Crypto market in the last 24h
🌍 Global crypto market cap: 2.61T USD (↓ 1.43%)
💸 Total 24h market volume: 186.99B USD (↓ 1.35%)
🔗 DeFi volume: 19.65B USD | 10.51% of total (↓)
🪙 Stablecoins volume: 182.91B USD | 97.82% of total (→ dominant)
₿ Bitcoin dominance: 59.40% (↑ 0.17%)
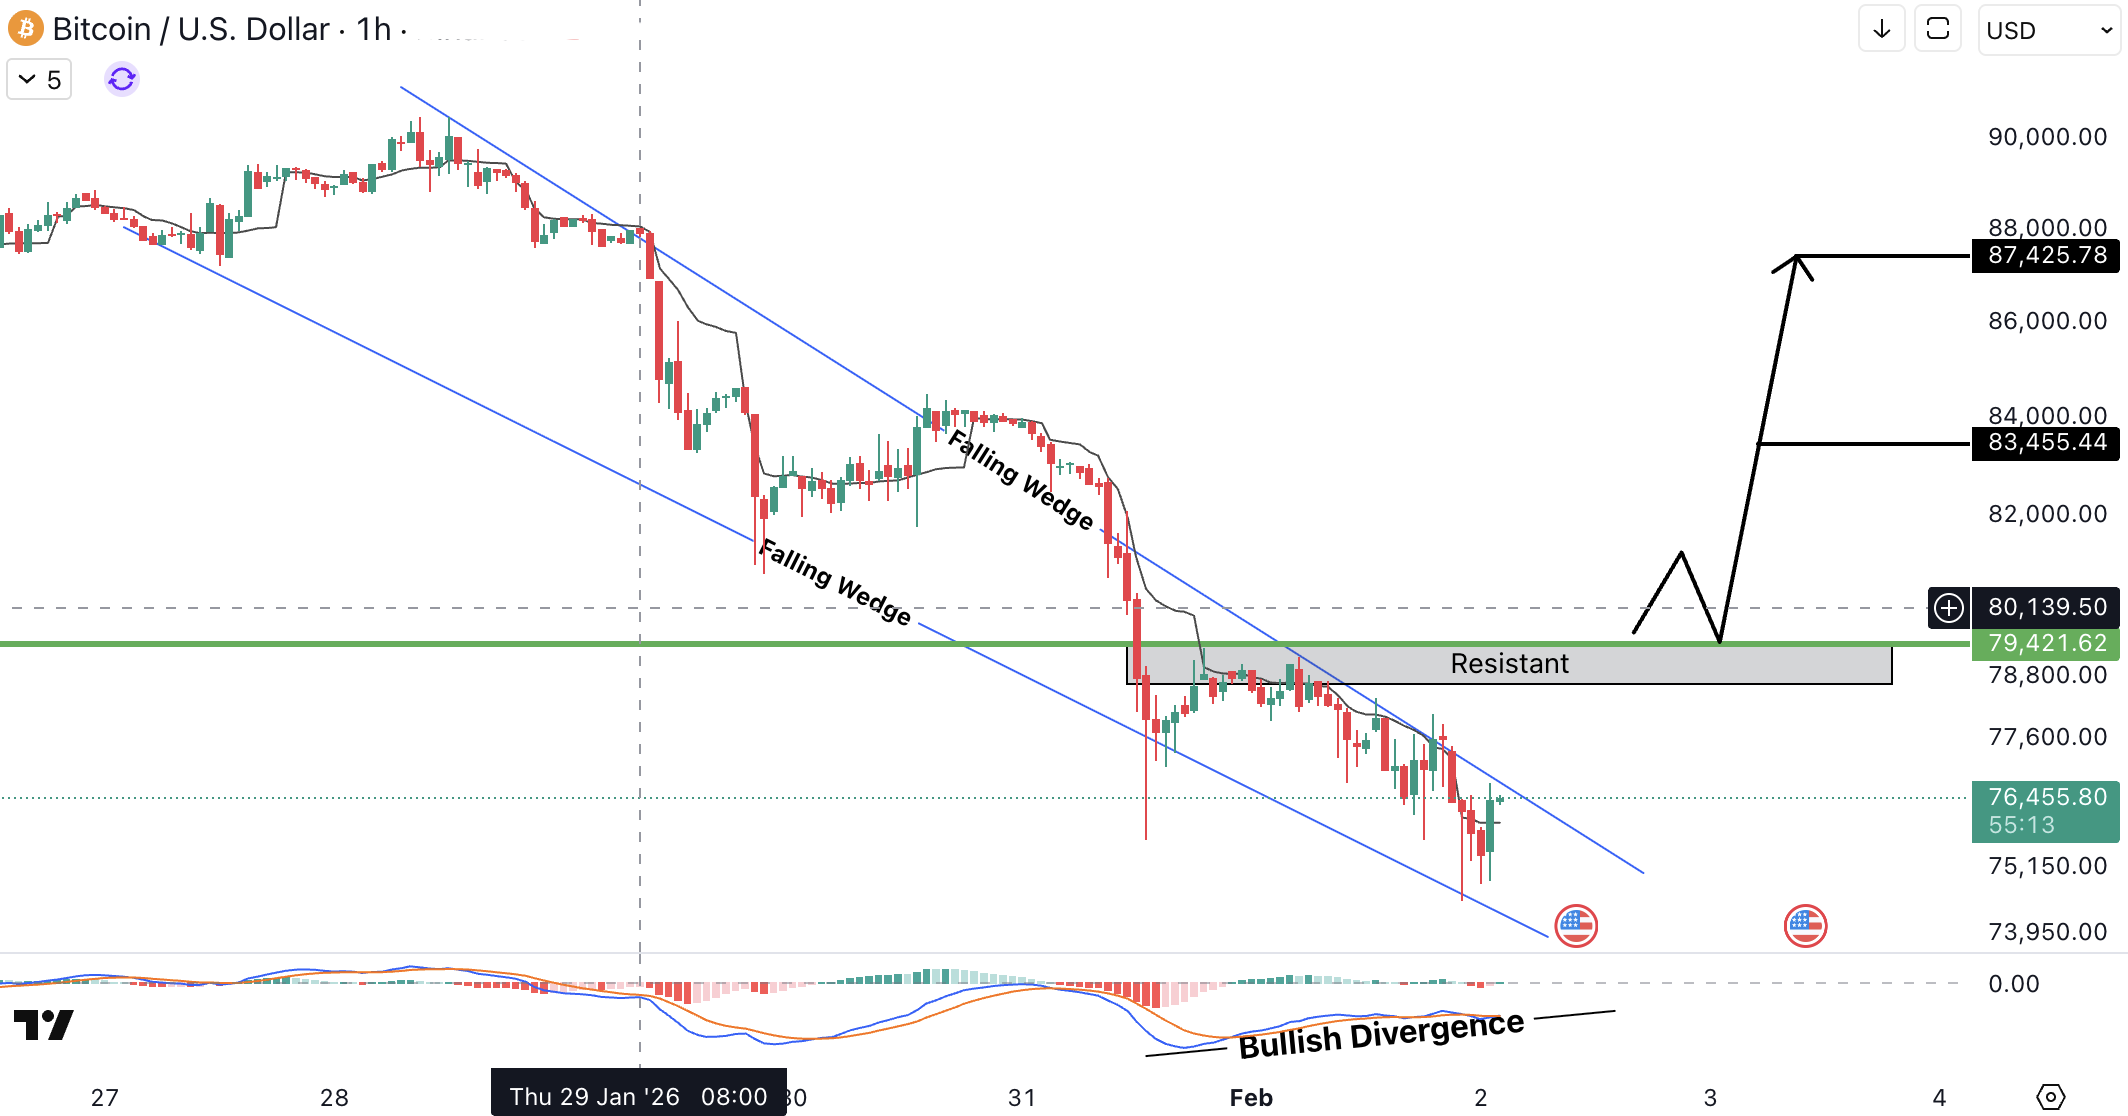
Bitcoin (BTC) analysis
BTCUSD is moving inside a falling wedge, supported by strong bullish divergence, signaling a potential reversal ahead. The major resistance zone is located around 79,421 USD (~73,071.32 EUR), and a clean breakout above this level could accelerate bullish momentum.
If buyers step in decisively, upside targets are projected near 83,450 USD (~76,774 EUR), followed by 87,400 USD (~80,408 EUR).
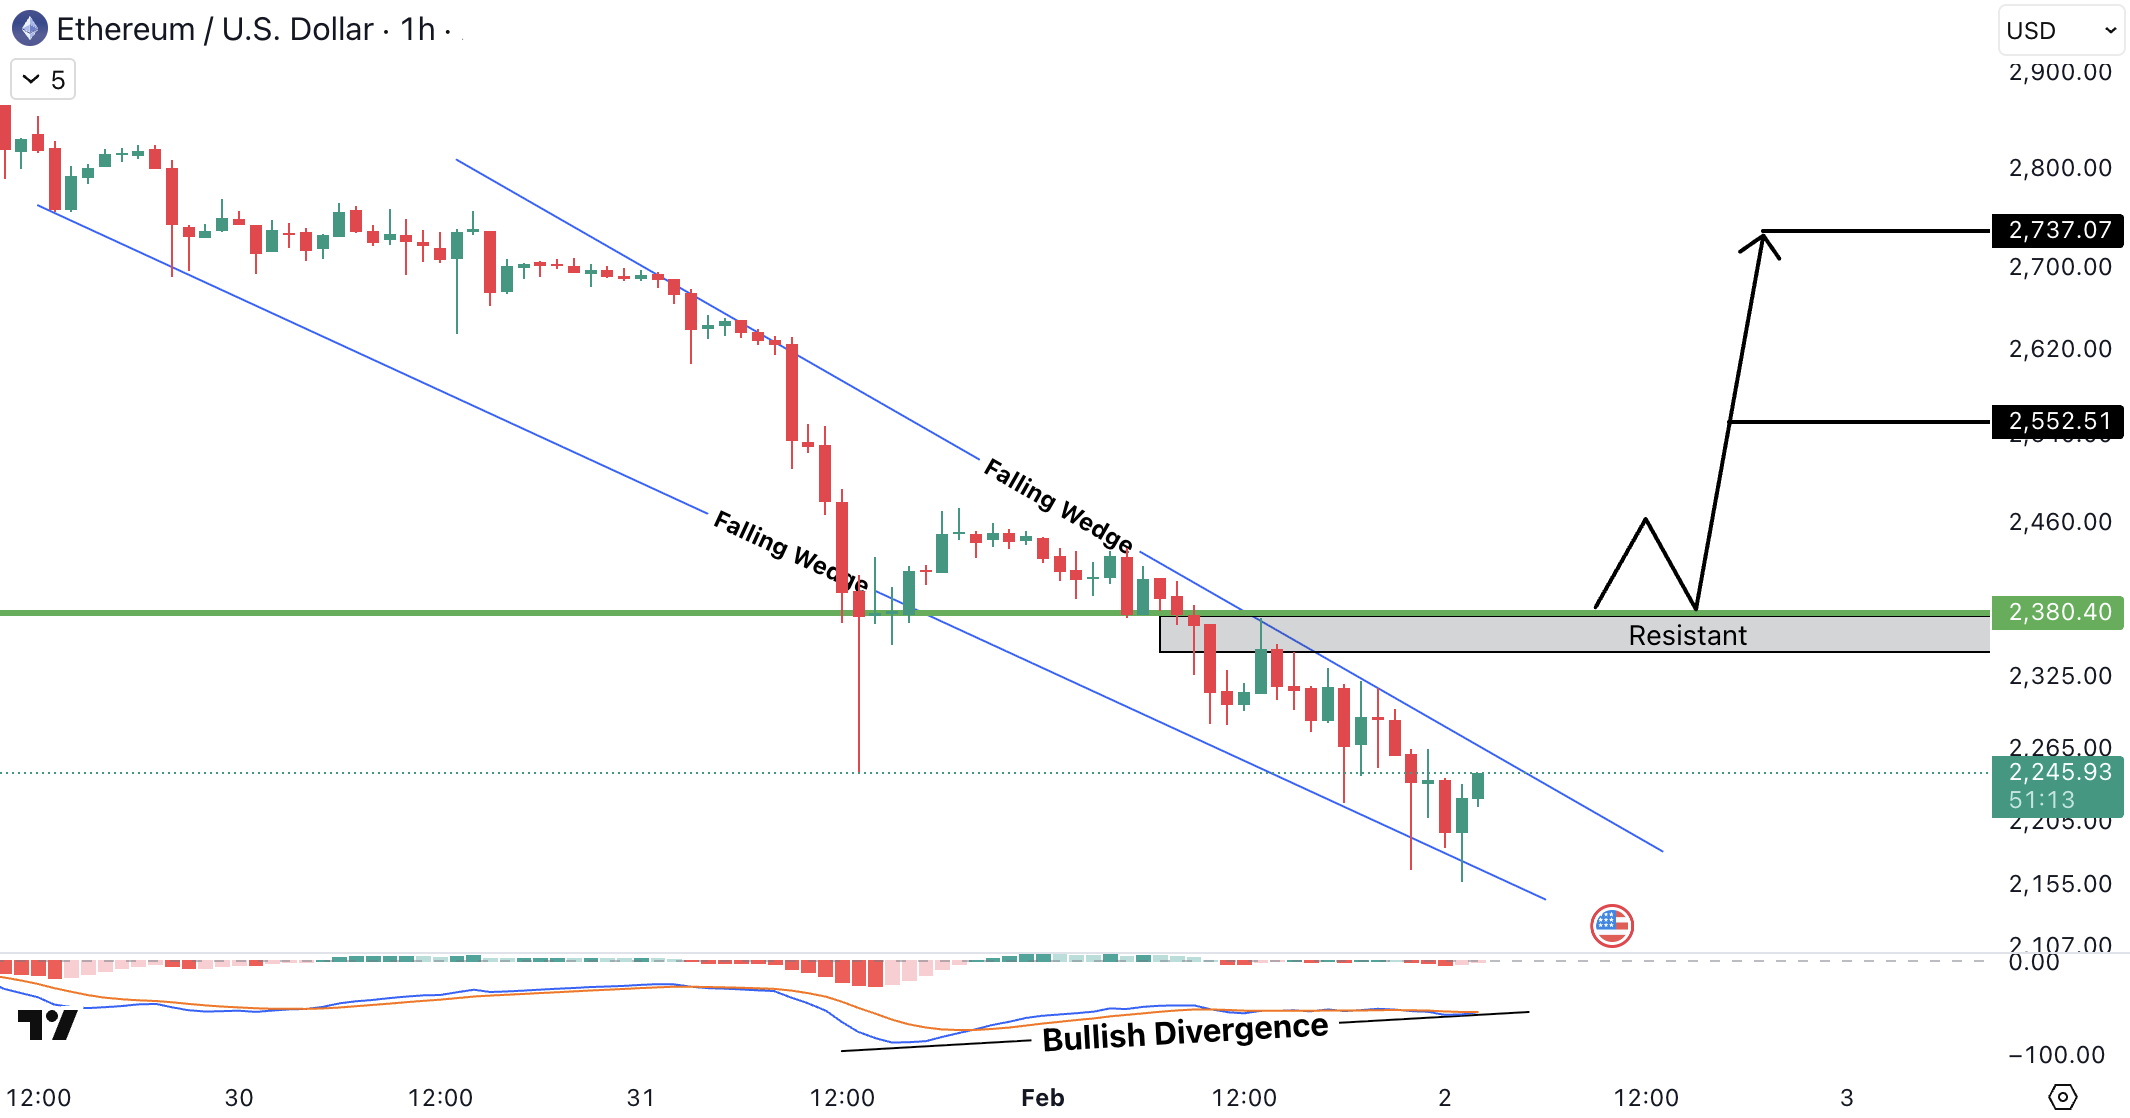
Ethereum (ETH) analysis
ETHUSD is trading within a falling wedge structure while showing a clear bullish divergence, indicating weakening selling pressure. The key resistance zone lies between 2,360 USD (~2,171.20 EUR) and 2,380 USD (~2,189.60 EUR).
A decisive breakout above this area could trigger upside momentum, with targets projected around 2,550 USD (~2,346 EUR) and then 2,730 USD (~2,511.60 EUR).
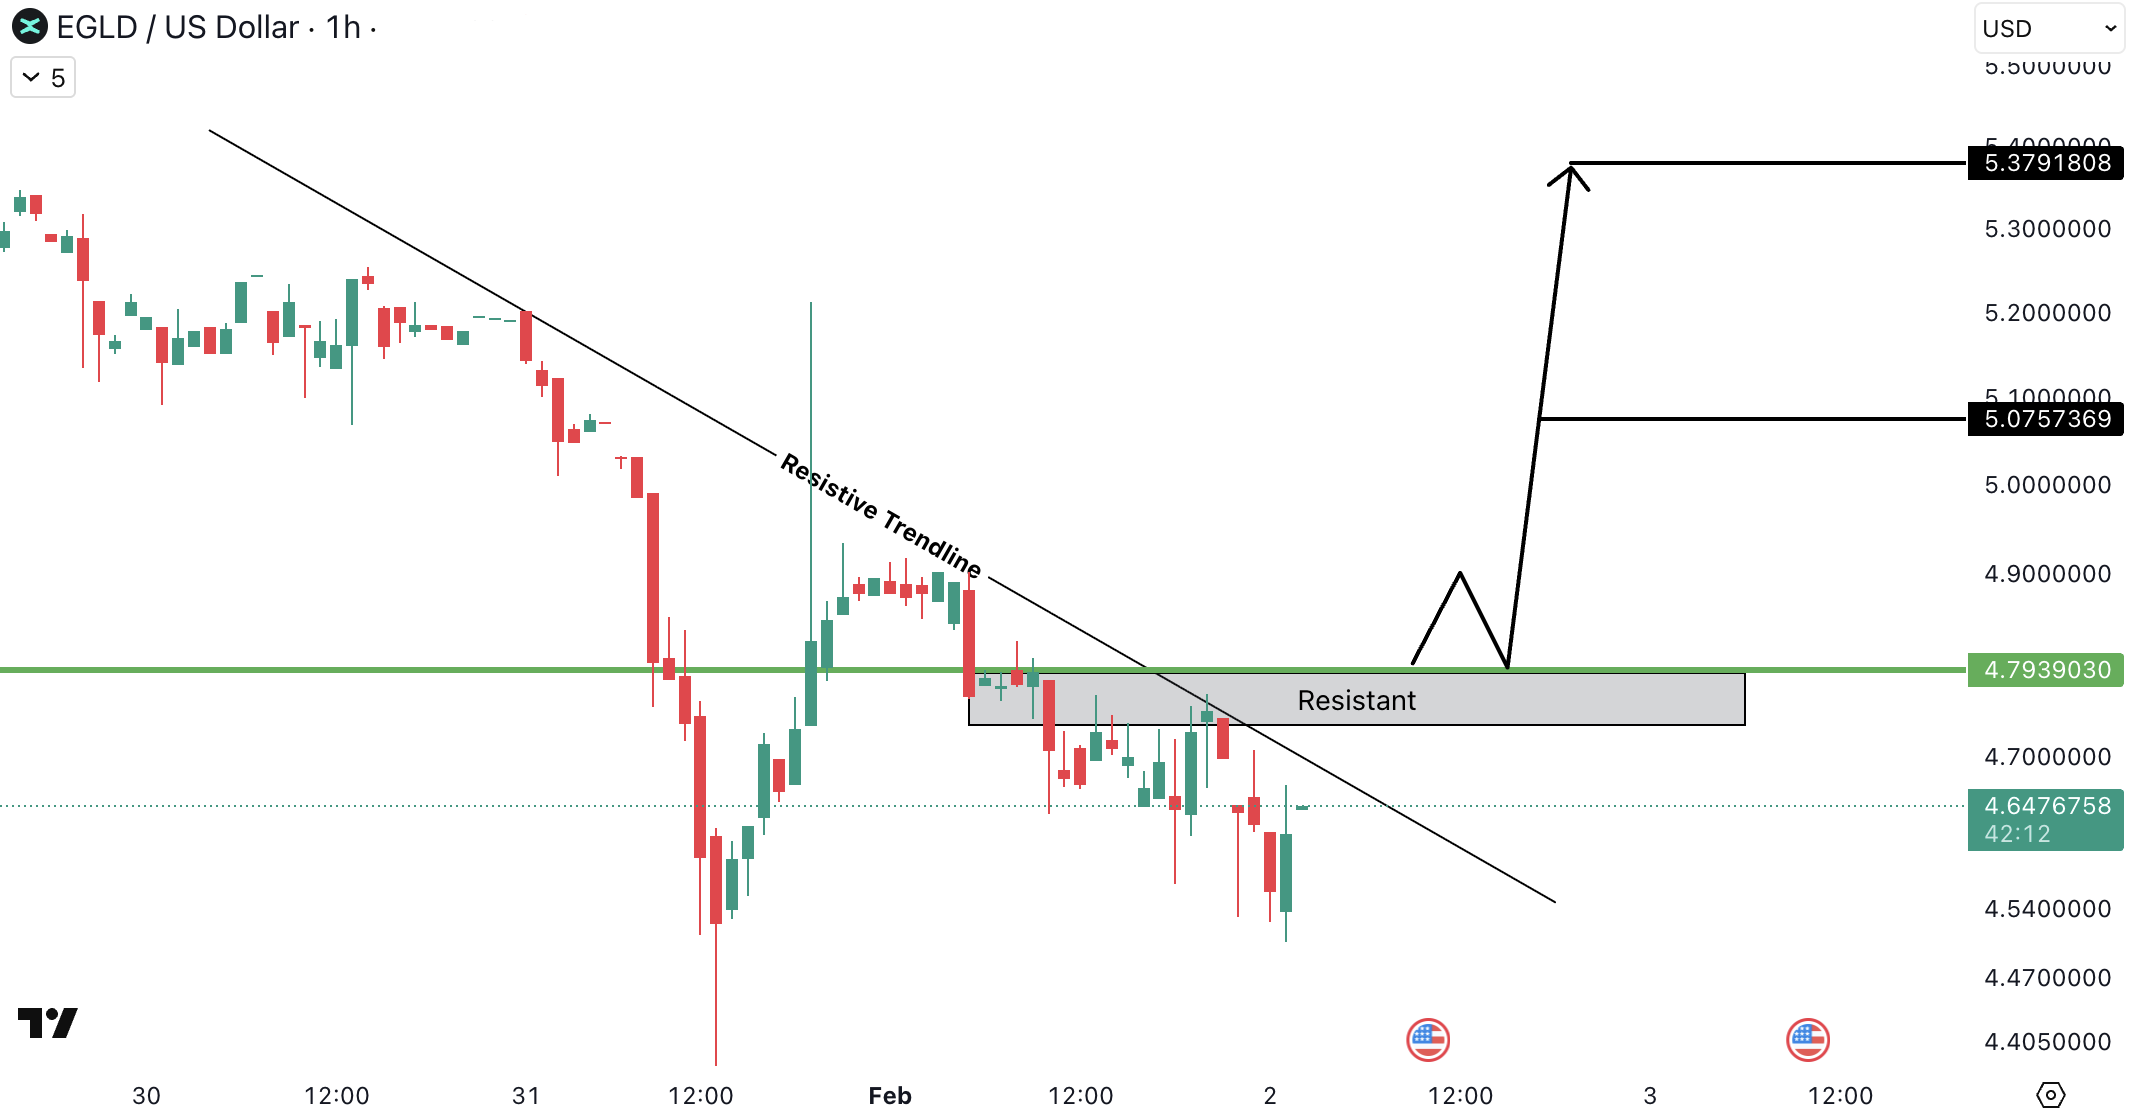
MultiversX (EGLD) analysis
EGLDUSD is facing a strong resistance zone between 4.75 USD (~4.37 EUR) and 4.80 USD (~4.42 EUR), aligned with the descending trendline, where price has been repeatedly rejected. This area represents a key supply zone.
A clean breakout above this resistance could trigger bullish momentum. Immediate resistance is located near 5.05 USD (~4.65 EUR), followed by higher targets around 5.38 USD (~4.95 EUR).
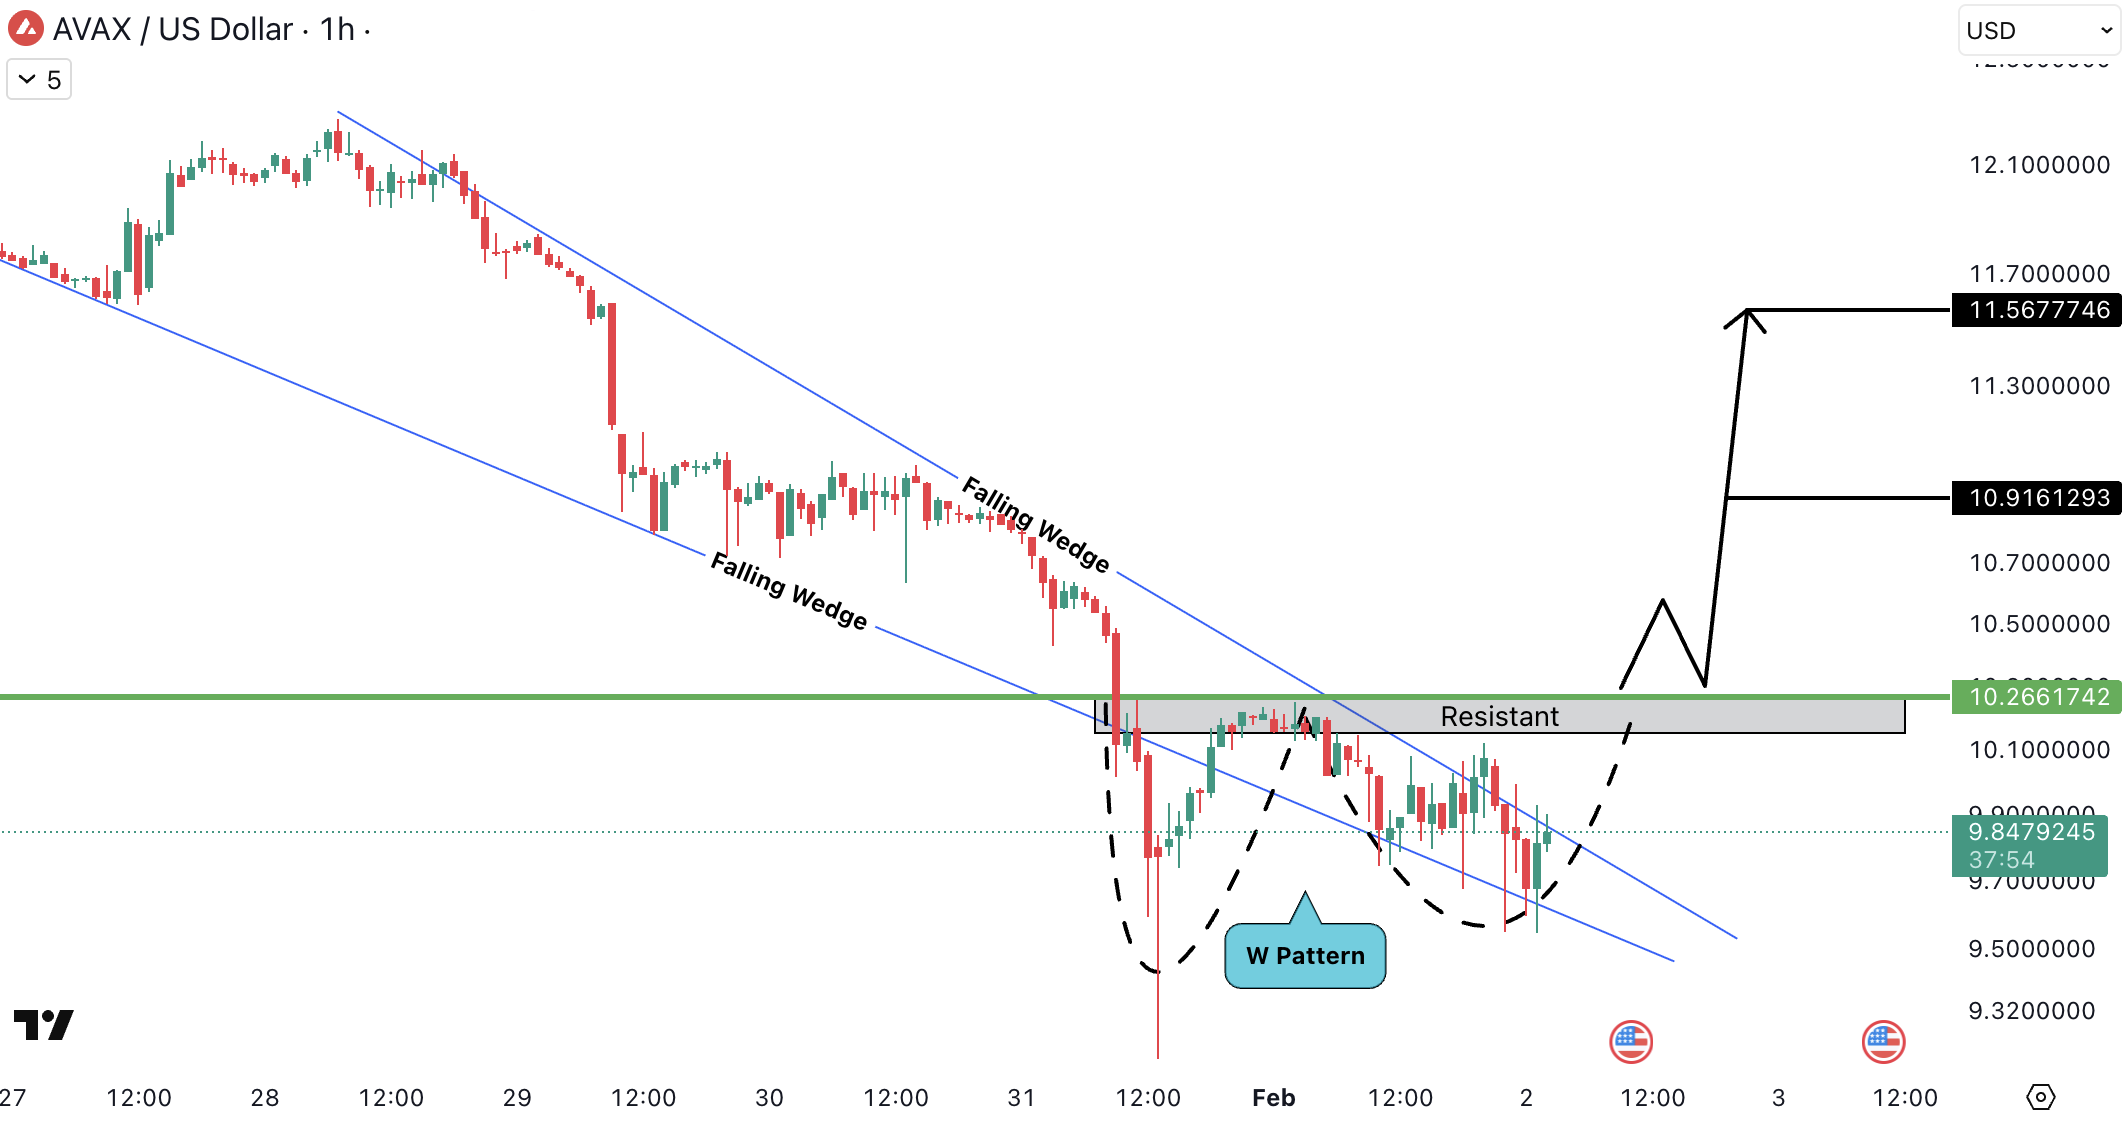
Avalanche (AVAX) analysis
AVAXUSD is trading below a key resistance zone between 10.20 USD (~9.38 EUR) and 10.30 USD (~9.48 EUR), which aligns with the upper boundary of the falling wedge and a prior supply area.
Price has formed a W pattern, suggesting accumulation, but confirmation requires a strong breakout above this resistance. A sustained move above 10.26 USD (~9.44 EUR) can open the path toward upside targets at 10.90 USD (~10.03 EUR) and 11.55 USD (~10.63 EUR).
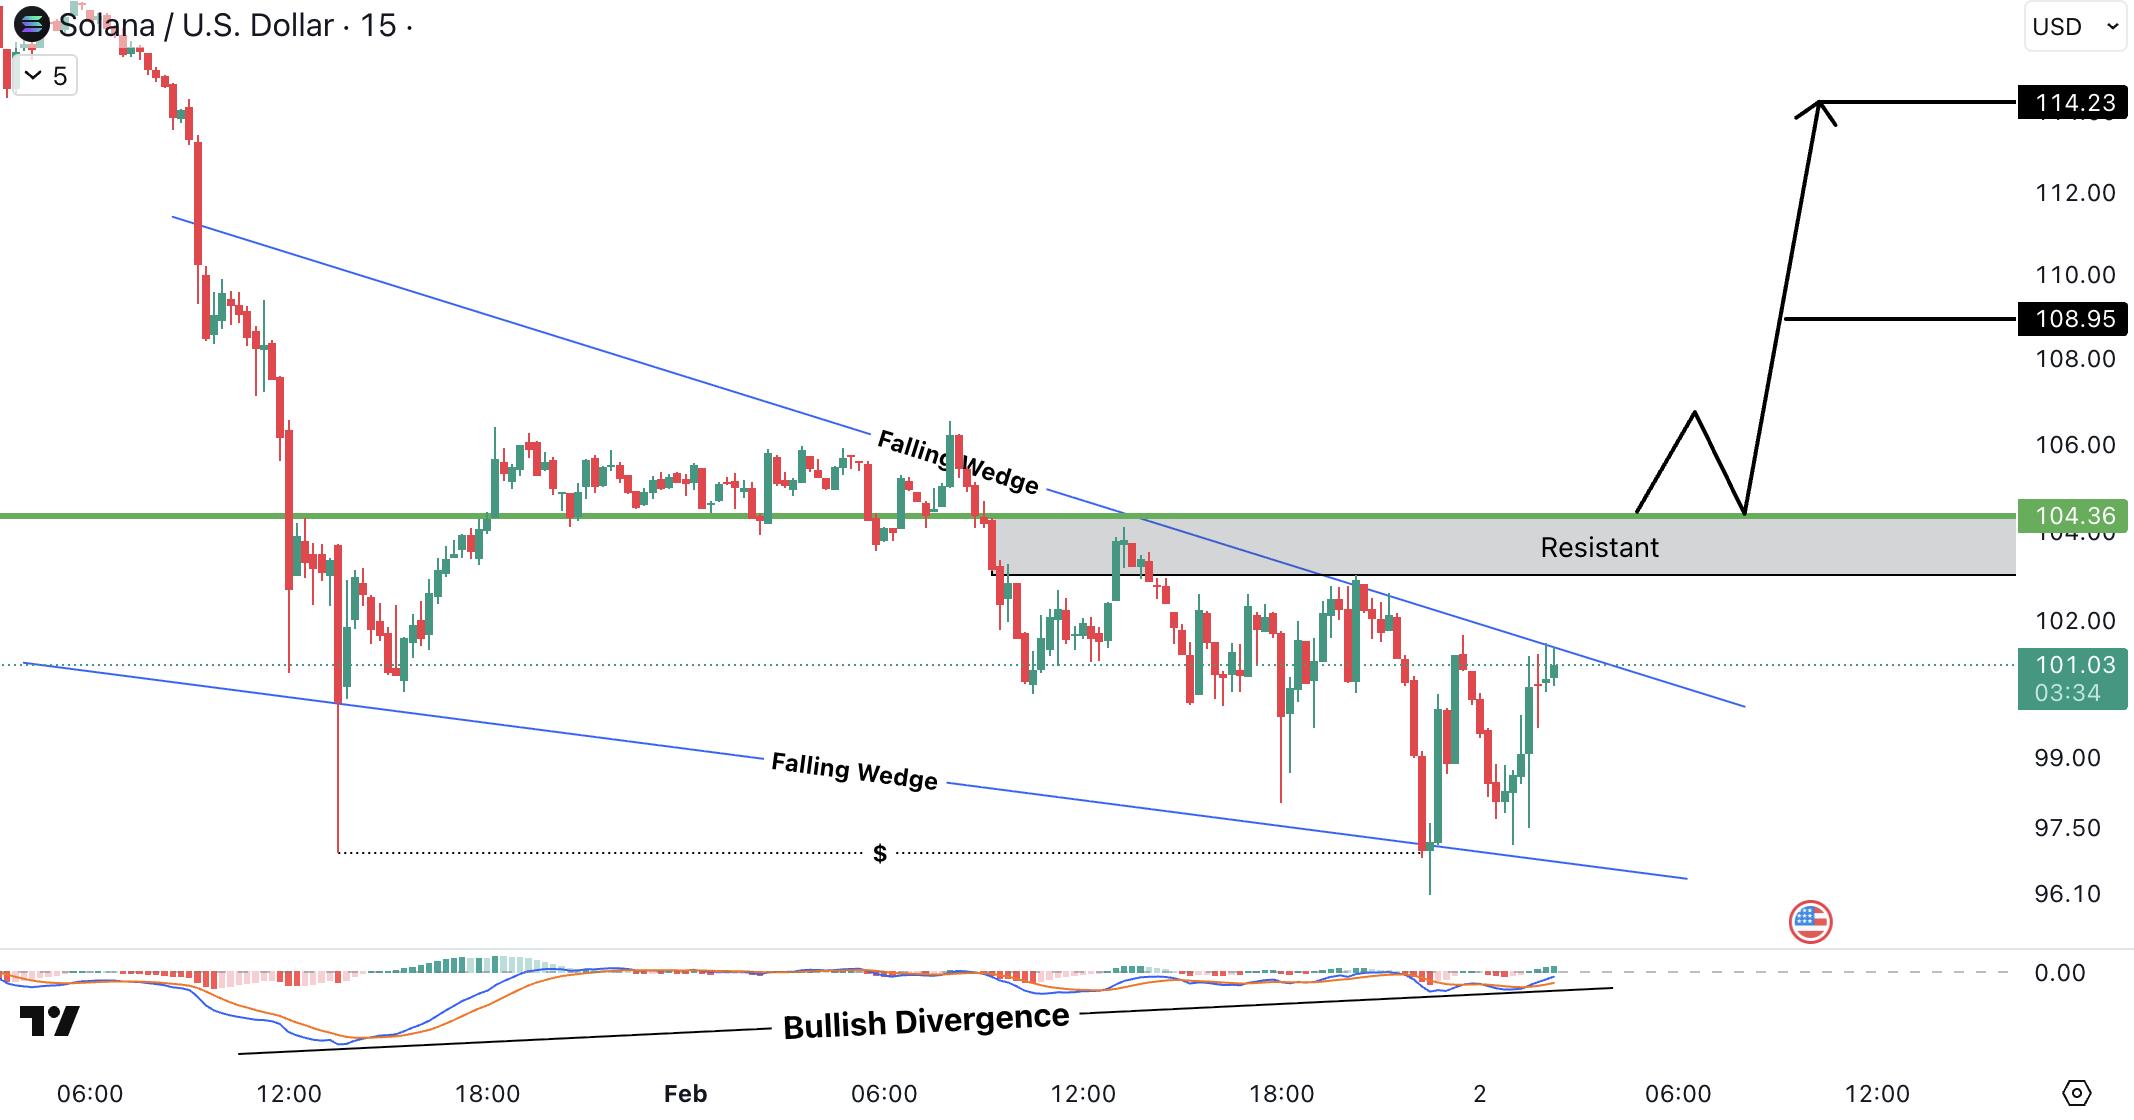
Solana (SOL) analysis
SOLUSD is forming a falling wedge structure while a clear bullish divergence is visible near support, signaling weakening downside momentum. On the upside, price is capped by a marked resistance zone between 103.80 USD (~95.50 EUR) and 104.50 USD (~96.14 EUR).
A clean breakout above this zone opens the path toward projected levels at 108.95 USD (~100.23 EUR) and 114.23 USD (~105.09 EUR).
Estimation (96H)
-
BTCUSD: 96H | 1% – 2% | DOWN | Liquidity available below
-
ETHUSD: 96H | 1% – 3% | DOWN | Liquidity available below
-
SOLUSD: 96H | 2% – 4% | UP | At support with bullish divergence
-
XRPUSD: 96H | 2% – 4% | UP | W pattern
-
ADAUSD: 96H | 2% – 4% | UP | W pattern
All cryptocurrencies are available for trading on Tradesilvania , and their prices can be seen on the Tradesilvania price page, accessible through the following link: https://tradesilvania.com/en/prices
With the help of our platform, you can deposit, withdraw, buy or sell any of these cryptocurrencies using the free digital wallet. SEPA Top-up (On-Ramp & Off-Ramp) Euro and RON instant transfers and over 150 cryptocurrencies, are all available in our app.
Limitation of Liability
This report issued by Tradesilvania is purely informative and is not intended to be used as a tool for making investment decisions in crypto-assets. Any person who chooses to use this report in the process of making investment decisions assumes all related risks. Tradesilvania SRL has no legal or other obligation towards the person in question that would derive from the publication of this report publicly.
The content provided on the Tradesilvania website is for informational purposes only and should not be considered as investment advice, financial advice, trading advice, or any other form of advice. We do not endorse or recommend the buying, selling, or holding of any cryptocurrency. It is important that you conduct your own research and consult with a financial advisor before making any investment decisions. We cannot be held responsible for any investment choices made based on the information presented on our website.
The information in this report was obtained from public sources and is considered relevant and reliable within the limits of publicly available data. However, the value of the digital assets referred to in this report fluctuates over time, and past performance does not indicate future growth.