Crypto market in the last 24h
🌍 Global crypto market cap: 2.39T USD (↑ 0.54%)
💸 Total crypto market volume 24h: 96.69B USD (↓ 18.82%)
🔗 DeFi volume 24h: 9.55B USD | 9.88% of total (↓)
🪙 Stablecoins volume 24h: 94.81B USD | 98.06% of total (↑)
₿ Bitcoin dominance: 58.96% (↑ 0.45%)
Bitcoin (BTC) analysis
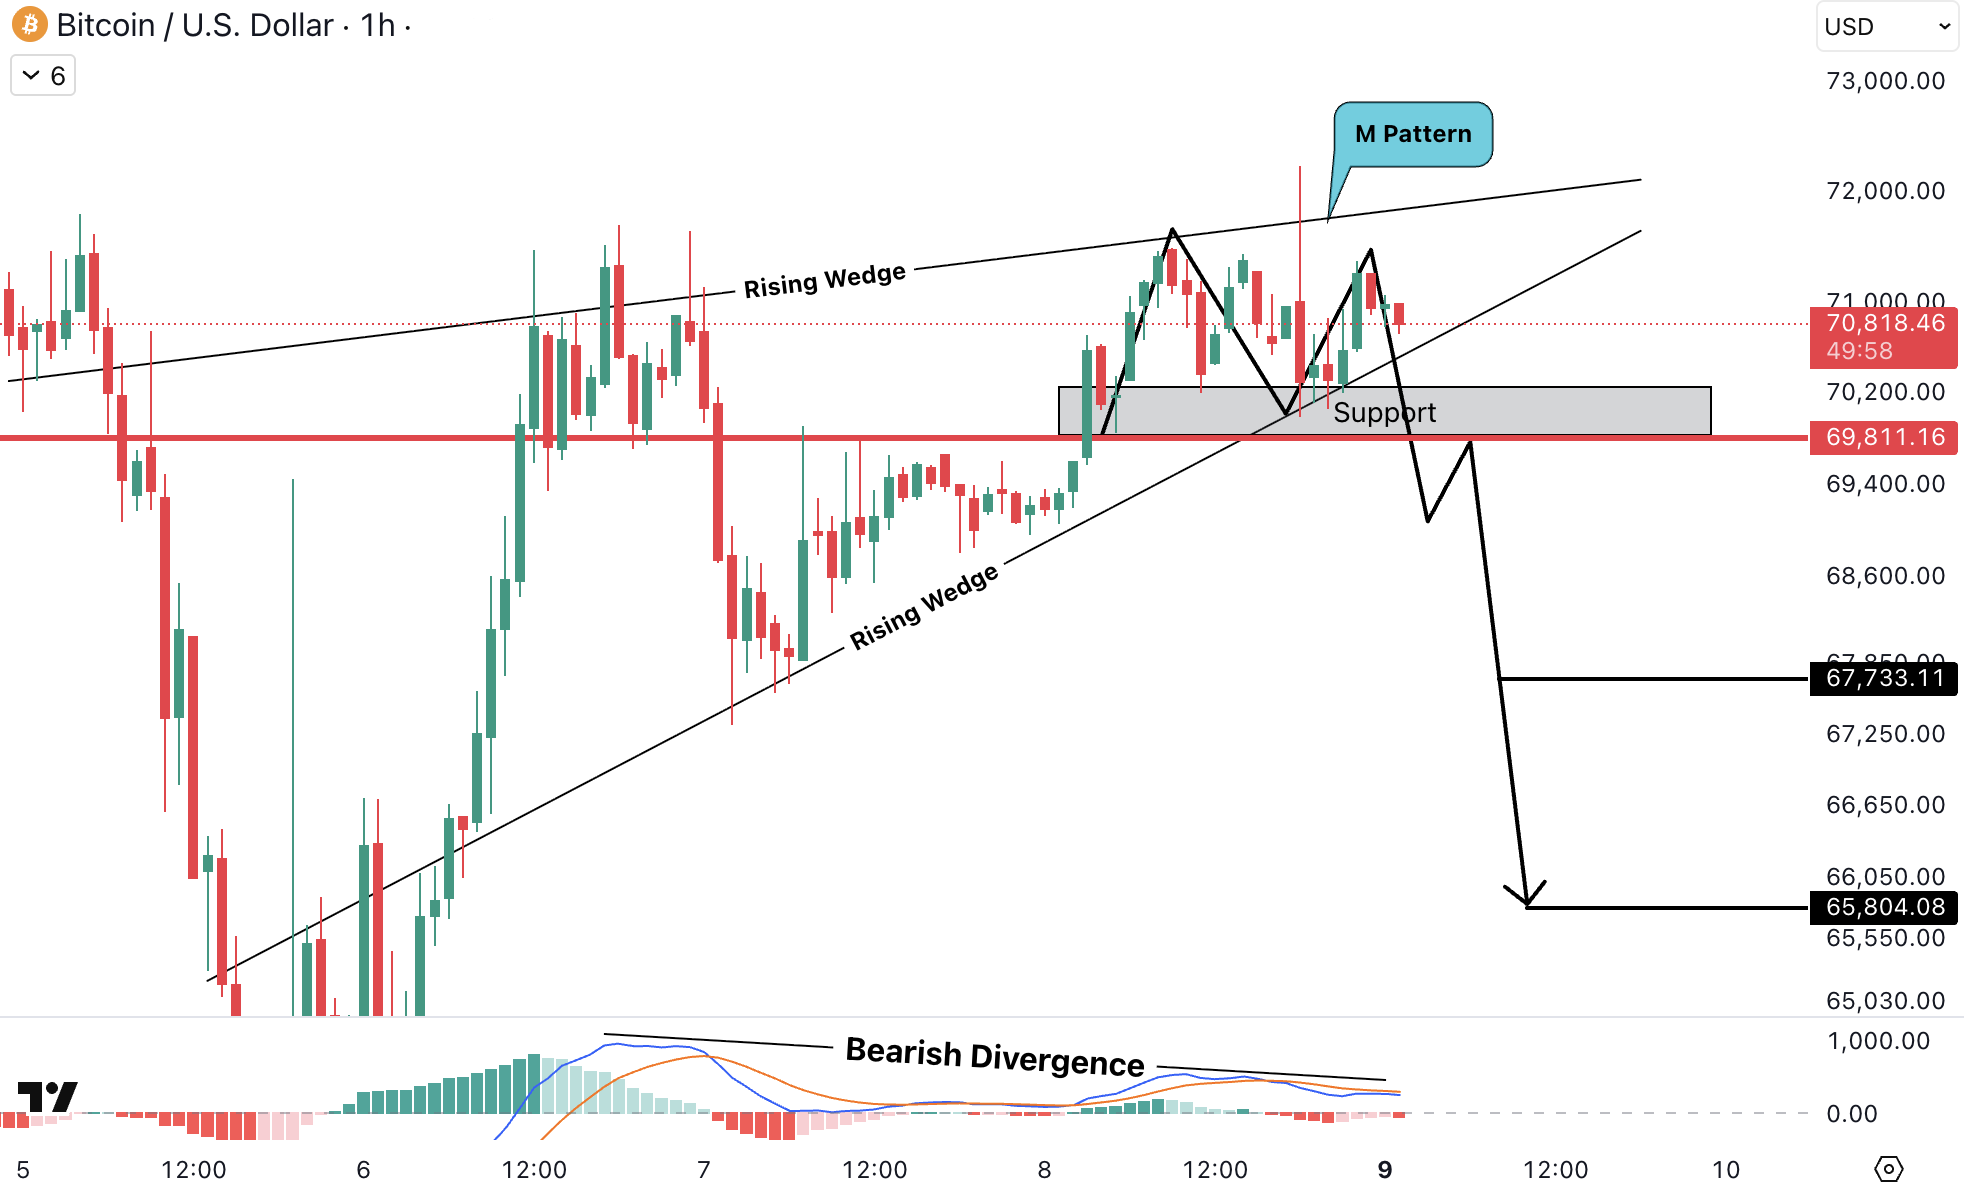
BTCUSD is currently trading inside a rising wedge formation on the 1H timeframe, with price holding just above the highlighted support zone between 70,200 USD (~64,584 EUR) and 69,800 USD (~64,216 EUR). This area is now the key level preserving the short-term structure.
Momentum indicators are showing bearish divergence, signaling weakening buying pressure as price retests the upper boundary of the wedge.
If price loses the support zone and confirms a breakdown from the rising wedge, a deeper corrective move could follow toward 67,733 USD (~62,304 EUR), with a possible extension to 65,800 USD (~60,536 EUR).
As long as the support holds and buyers defend the level, BTC may continue consolidating inside the structure before a decisive move occurs.
Ethereum (ETH) analysis
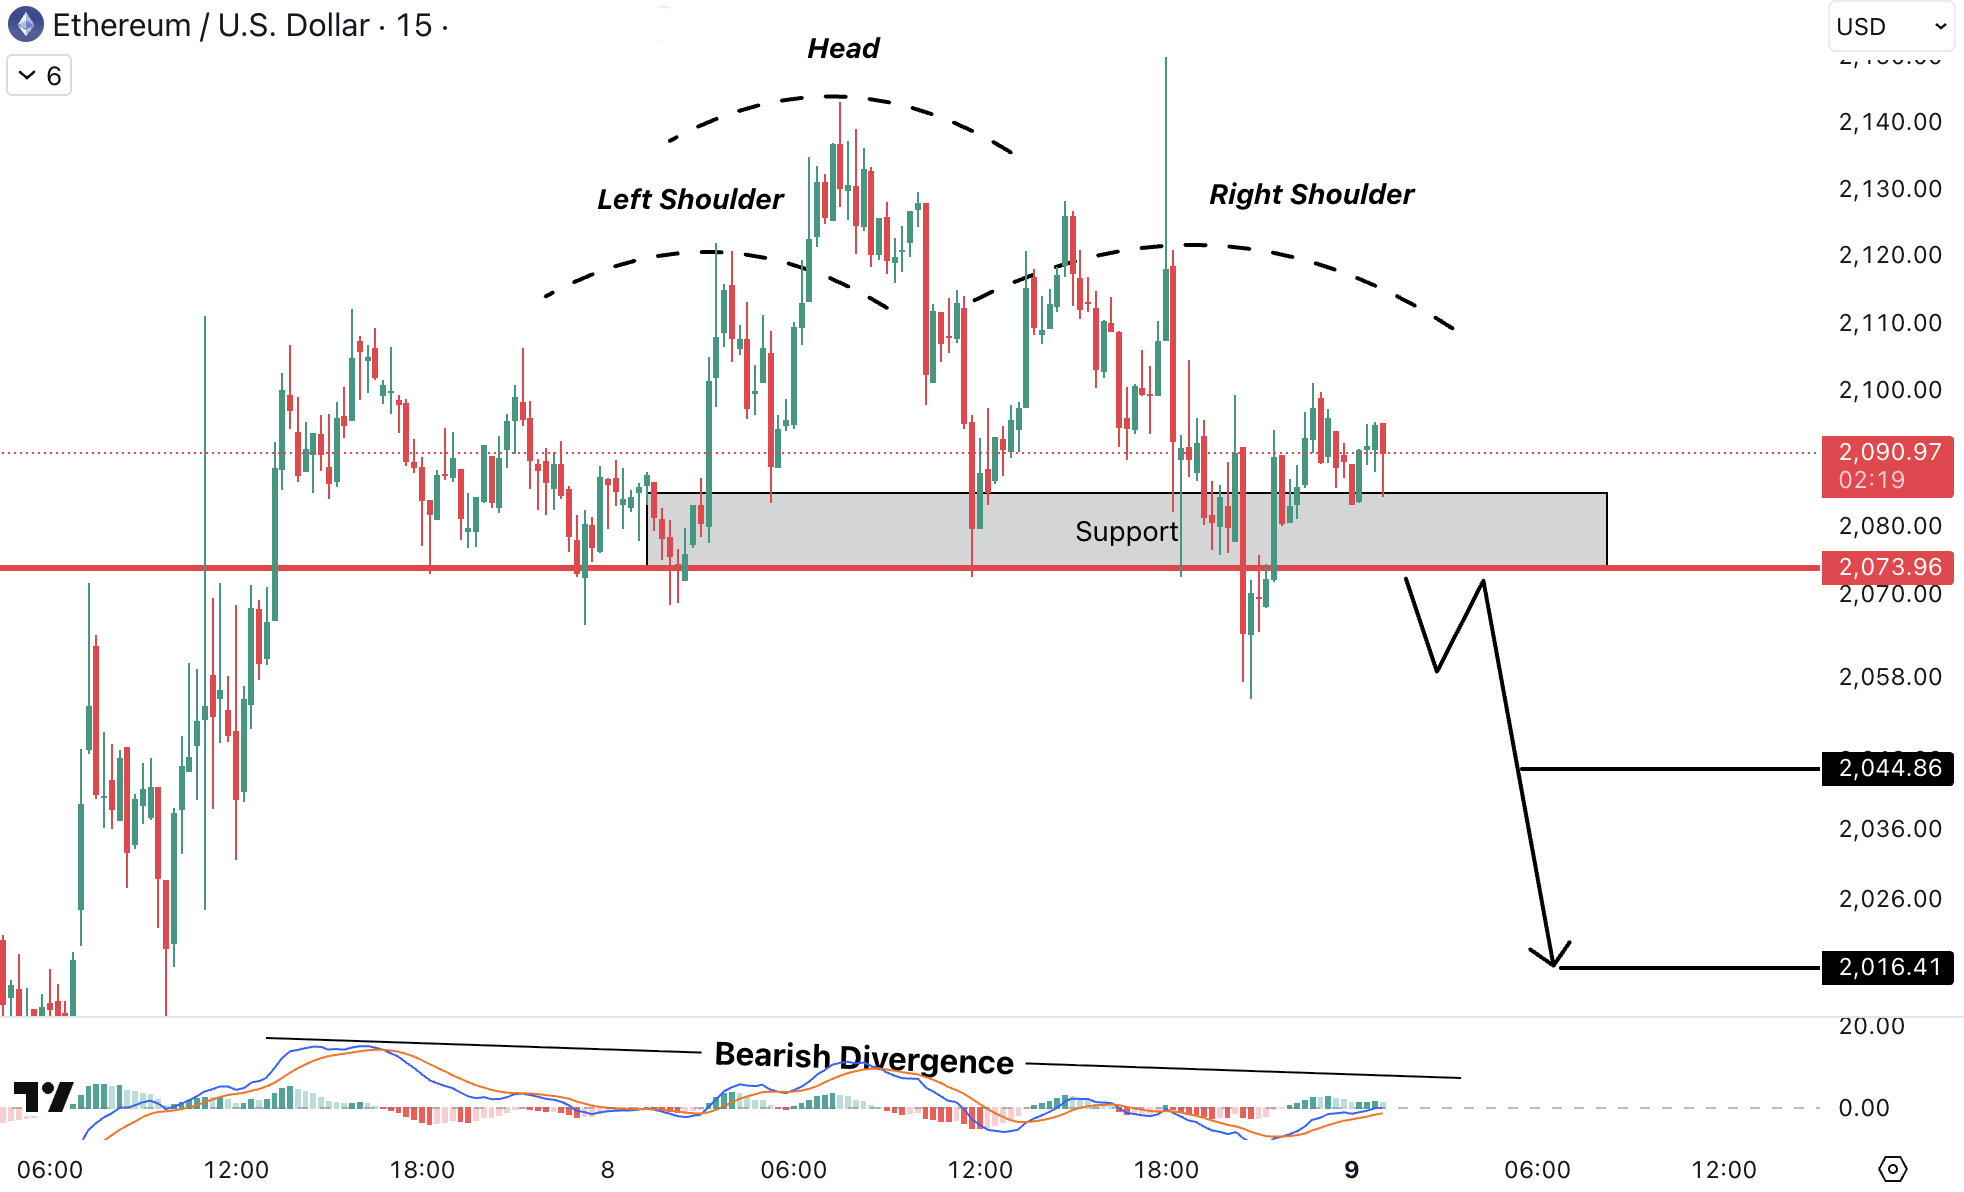
On the 15-minute timeframe, ETHUSD is forming a potential head and shoulders structure, with price currently reacting around the support zone between 2,080 USD (~1,914 EUR) and 2,070 USD (~1,904 EUR). This level represents the neckline and remains the key short-term directional level.
Momentum indicators show bearish divergence, suggesting buying pressure is fading after the formation of the right shoulder.
A confirmed breakdown and sustained move below the support zone could trigger further downside toward 2,044 USD (~1,880 EUR) and potentially extend to 2,016 USD (~1,855 EUR).
If buyers manage to defend the neckline and reclaim higher levels, the bearish scenario may be invalidated and price could continue ranging above support.
MultiversX (EGLD) analysis
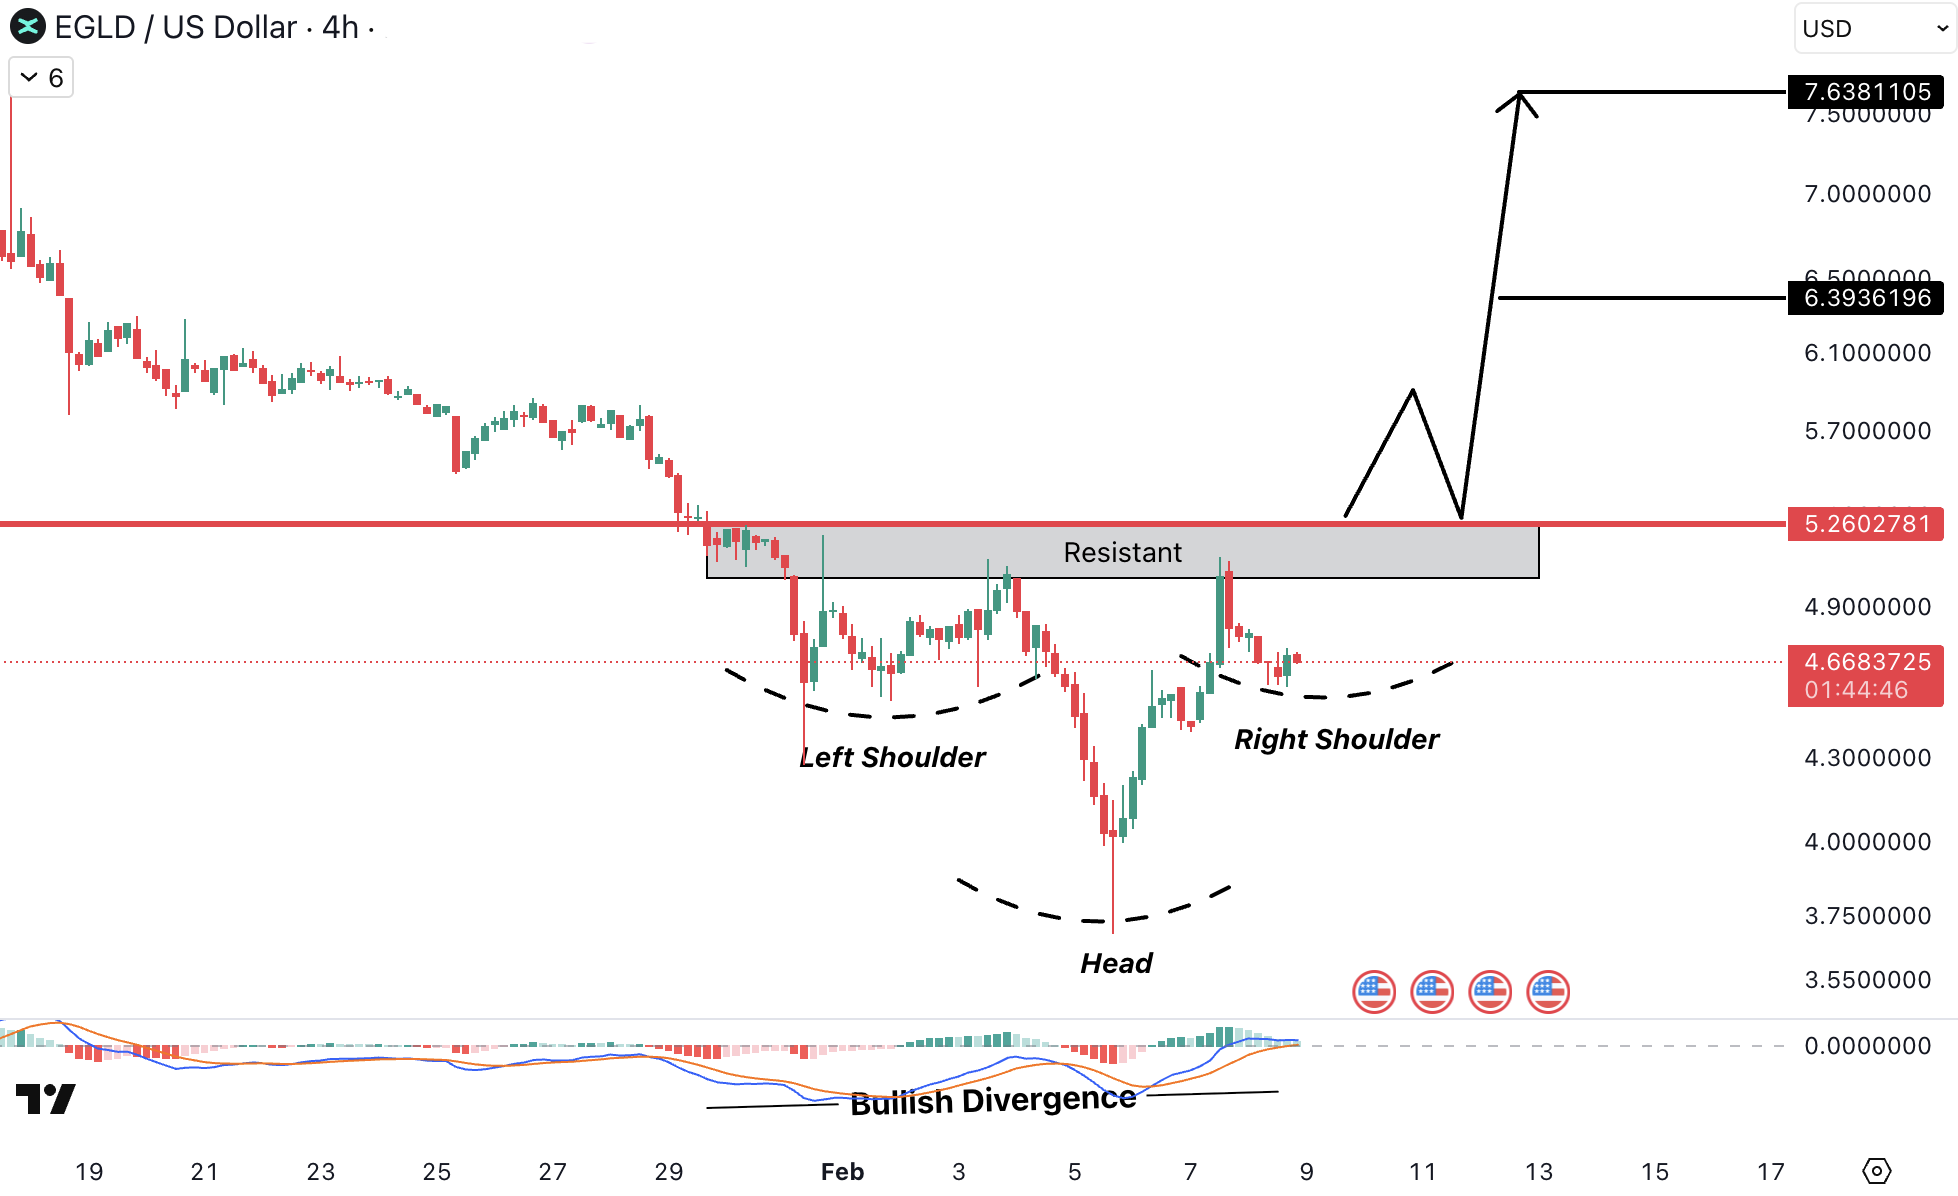
On the 4-hour timeframe, EGLDUSD is forming an inverse head and shoulders pattern, with price currently trading below the highlighted resistance zone around 5.20 USD (~4.78 EUR) to 5.30 USD (~4.88 EUR). This area acts as the neckline and remains the main barrier for a bullish reversal.
The chart shows bullish divergence, indicating weakening selling pressure after the head formation near recent lows.
A clean breakout and reclaim above the resistance zone could trigger upside momentum toward 6.39 USD (~5.88 EUR), with a potential extension to 7.63 USD (~7.02 EUR).
Failure to reclaim the neckline keeps the structure unconfirmed, and price may continue consolidating or retesting lower levels before any sustained upside move.
Chainlink (LINK) analysis
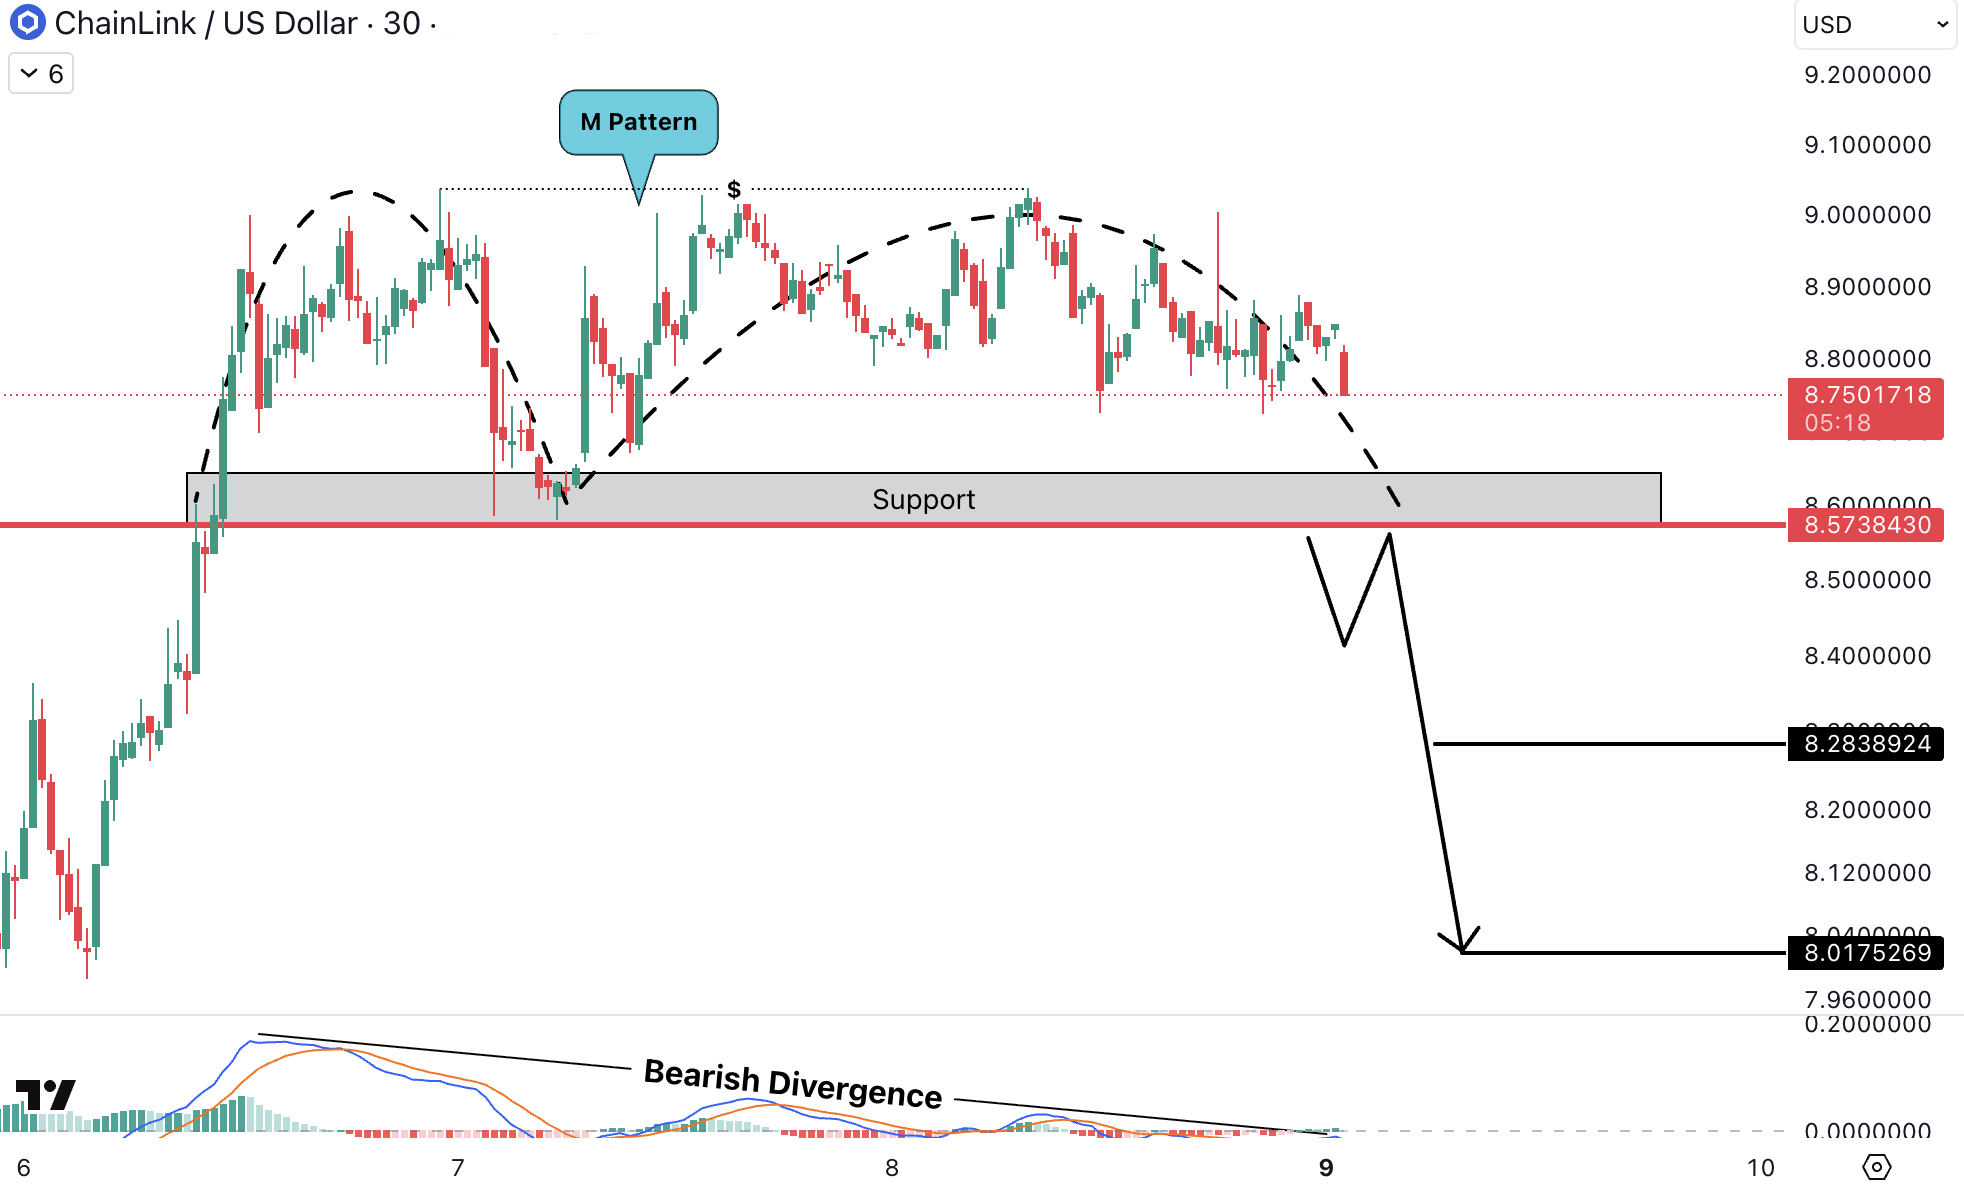
LINKUSD, on the 30-minute timeframe, is forming an M-pattern (double top), with price hovering just above the highlighted support zone around 8.57 USD (~7.88 EUR). This level represents the key demand area holding the structure, while momentum continues to weaken.
Clear bearish divergence suggests buyers are losing strength near the recent highs around 9 USD (~8.28 EUR).
A confirmed breakdown and close below the support zone could trigger downside continuation toward 8.28 USD (~7.62 EUR) and potentially extend to 8.01 USD (~7.37 EUR).
If price manages to reclaim strength and hold above support, the breakdown scenario weakens and LINK may shift back into consolidation rather than an immediate drop.
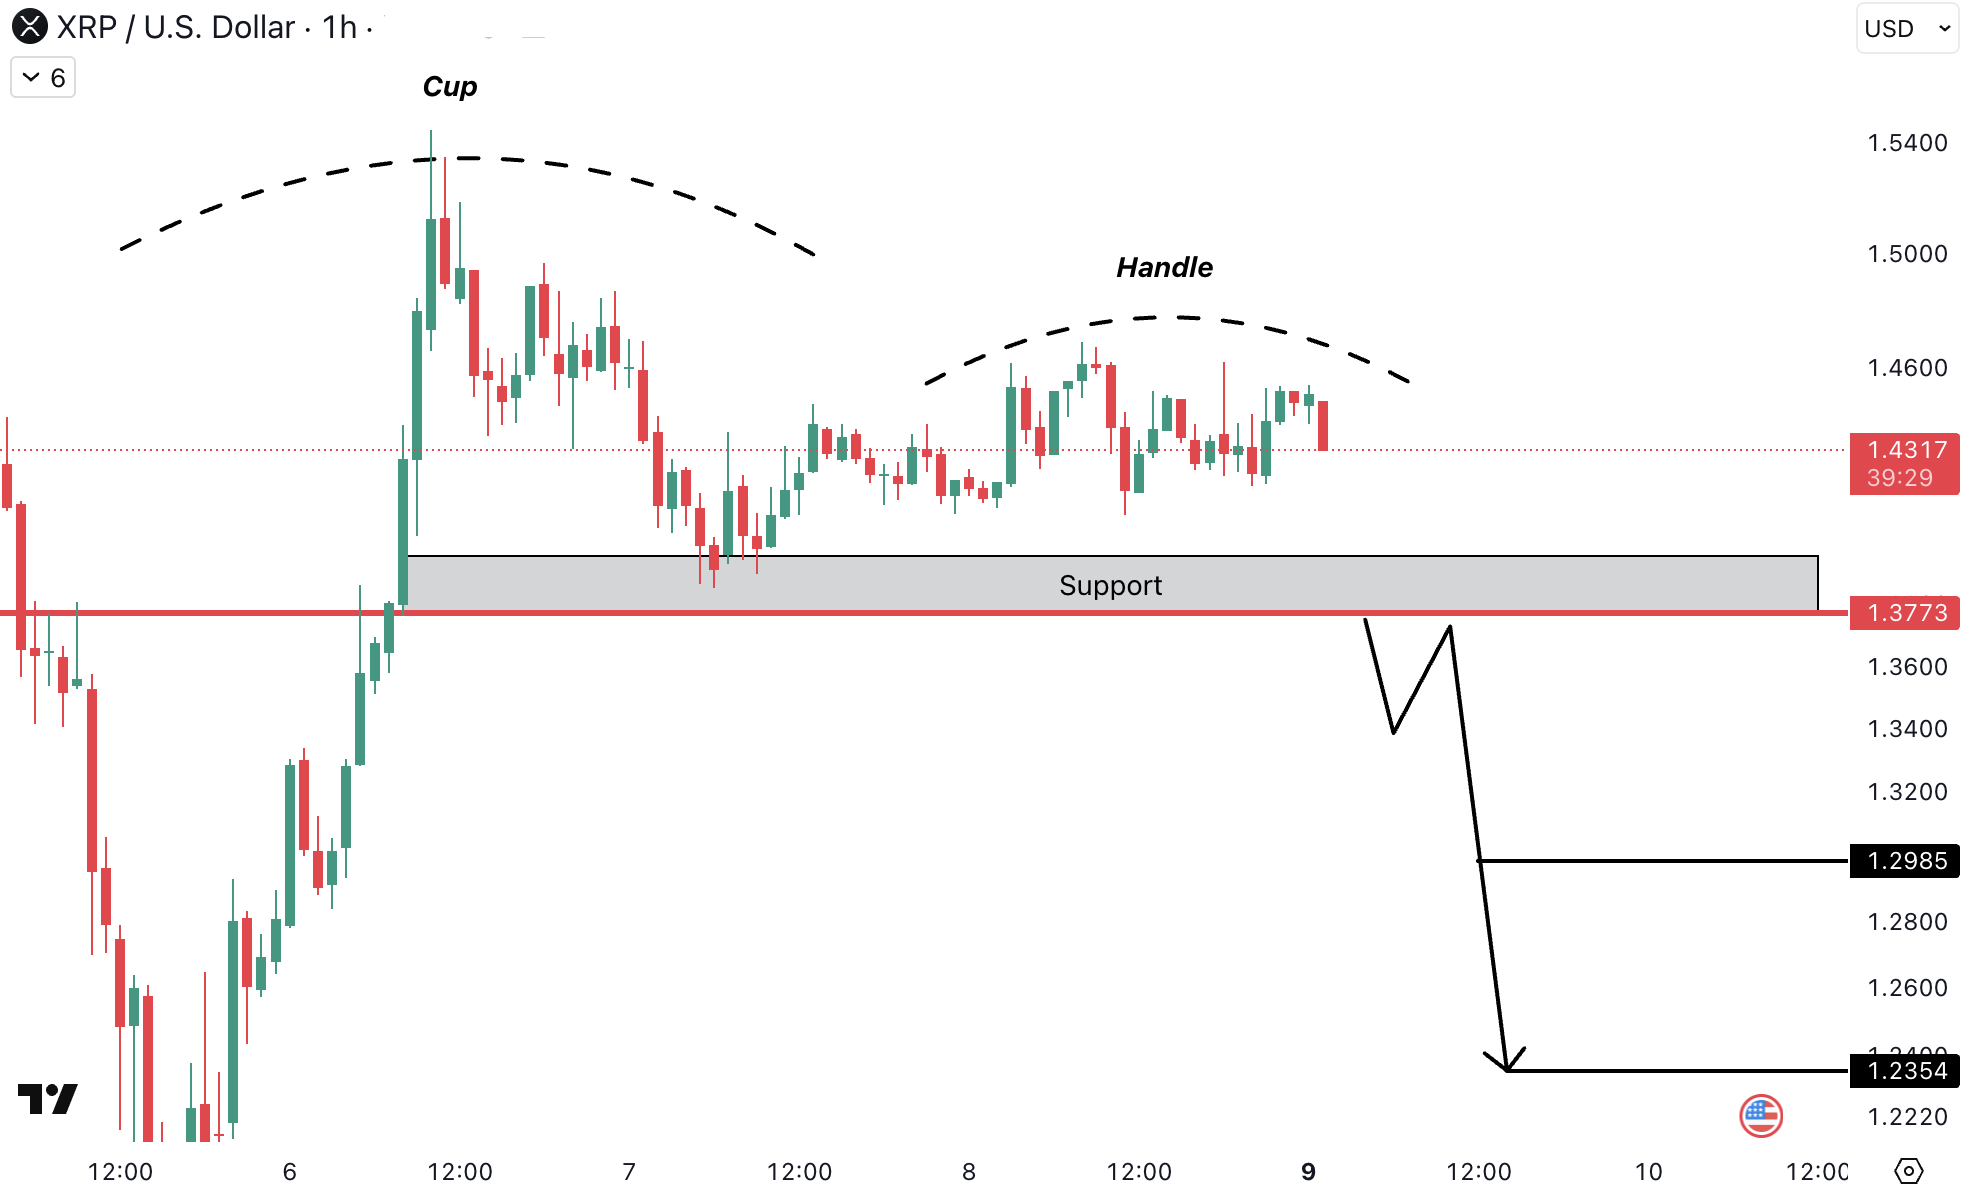
XRP (XRP) analysis
On the 1-hour timeframe, XRPUSD is forming an inverse cup-and-handle structure, with price consolidating above the highlighted support zone around 1.37 USD (~1.26 EUR). This area acts as the base of the pattern and will determine the next directional move.
The handle shows weakening bullish momentum, with price struggling to push higher after the cup formation.
A confirmed breakdown and close below support could invalidate the bullish structure and trigger bearish continuation toward 1.29 USD (~1.19 EUR), with an extended downside target near 1.23 USD (~1.13 EUR).
As long as support holds, XRP may continue ranging inside the handle, keeping the breakout scenario alive.
Estimation (96H outlook)
-
BTCUSD: 1% – 2% | DOWN | Market is in downtrend
-
ETHUSD: 1% – 3% | DOWN | Market is in downtrend
-
BNBUSD: 2% – 4% | DOWN | Market is in downtrend
-
DOGEUSD: 2% – 4% | DOWN | Market is in downtrend
-
ALGOUSD: 2% – 4% | DOWN | Market is in downtrend
All cryptocurrencies are available for trading on Tradesilvania , and their prices can be seen on the Tradesilvania price page, accessible through the following link: https://tradesilvania.com/en/prices
With the help of our platform, you can deposit, withdraw, buy or sell any of these cryptocurrencies using the free digital wallet. SEPA Top-up (On-Ramp & Off-Ramp) Euro and RON instant transfers and over 150 cryptocurrencies, are all available in our app.
Limitation of Liability
This report issued by Tradesilvania is purely informative and is not intended to be used as a tool for making investment decisions in crypto-assets. Any person who chooses to use this report in the process of making investment decisions assumes all related risks. Tradesilvania SRL has no legal or other obligation towards the person in question that would derive from the publication of this report publicly.
The content provided on the Tradesilvania website is for informational purposes only and should not be considered as investment advice, financial advice, trading advice, or any other form of advice. We do not endorse or recommend the buying, selling, or holding of any cryptocurrency. It is important that you conduct your own research and consult with a financial advisor before making any investment decisions. We cannot be held responsible for any investment choices made based on the information presented on our website.
The information in this report was obtained from public sources and is considered relevant and reliable within the limits of publicly available data. However, the value of the digital assets referred to in this report fluctuates over time, and past performance does not indicate future growth.