Market update in the last 24 hours
🌍 Global crypto market cap: 2.31T USD (-1.76% ↓)
📊 Total crypto volume 24h: 82.35B USD (-2.20% ↓)
🔗 DeFi volume: 8.9B USD | 10.81% of total (-)
🪙 Stablecoins volume: 82.08B USD | 99.67% of total (-)
₿ Bitcoin dominance: 58.15% (+0.10% ↑)
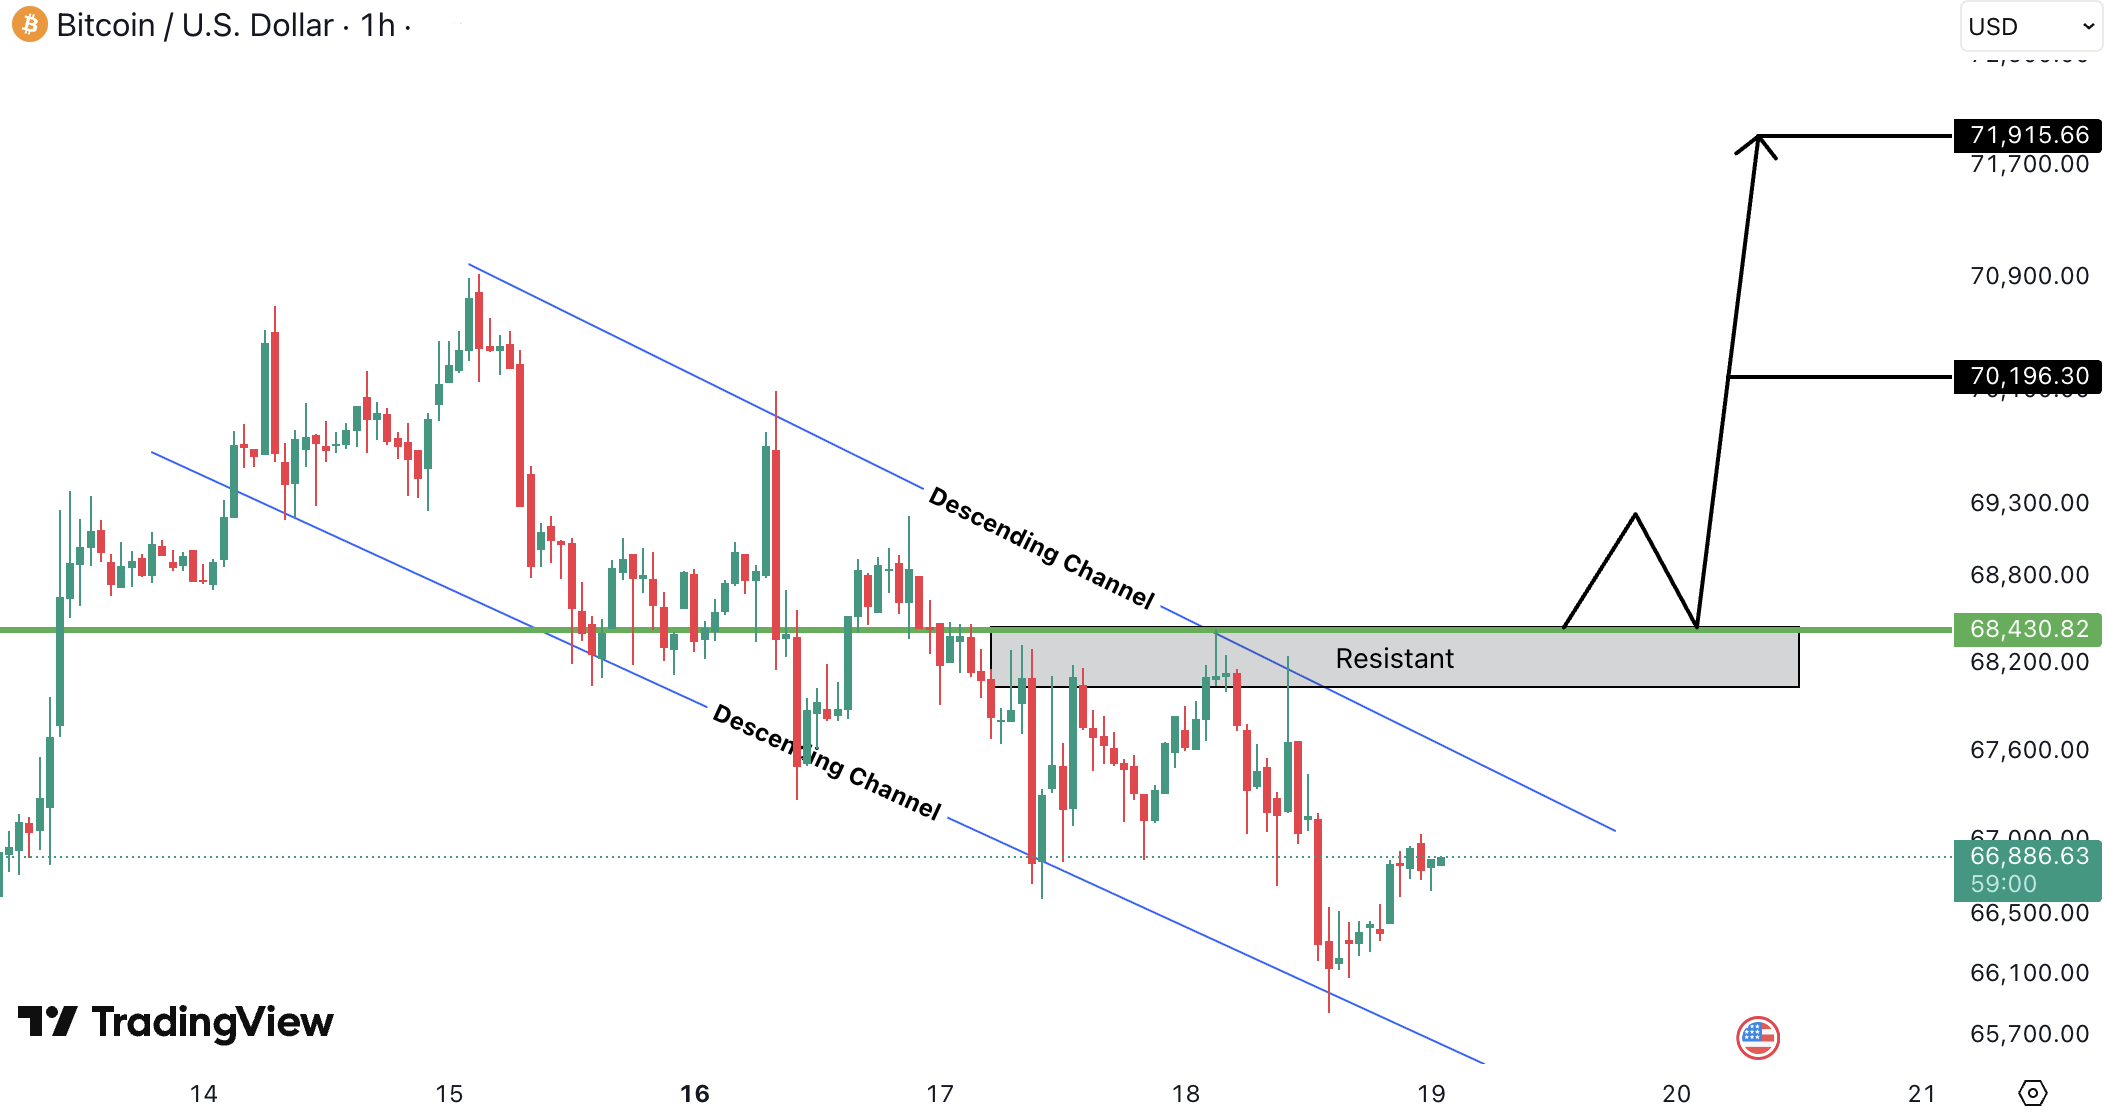
Bitcoin (BTC) analysis
BTCUSD is currently trading inside a descending channel on the 1H timeframe, reflecting a short-term bearish structure while price continues to respect the trendline resistance. The highlighted resistance zone around 68,200 – 68,430 USD (62,744.00 – 62,956 EUR) remains the key barrier for any potential bullish reversal, as multiple rejections have already occurred in this area.
Price is currently holding near the lower portion of the channel around 66,800 USD (61,456 EUR), indicating weak momentum but also the potential for a relief bounce. A clean breakout and reclaim above the resistance zone would signal strength and could open upside targets toward 70,196 USD (64,580.32 EUR) and further 71,915 USD (66,161.80 EUR). Continued rejection, however, keeps the market under pressure and maintains the descending channel structure.
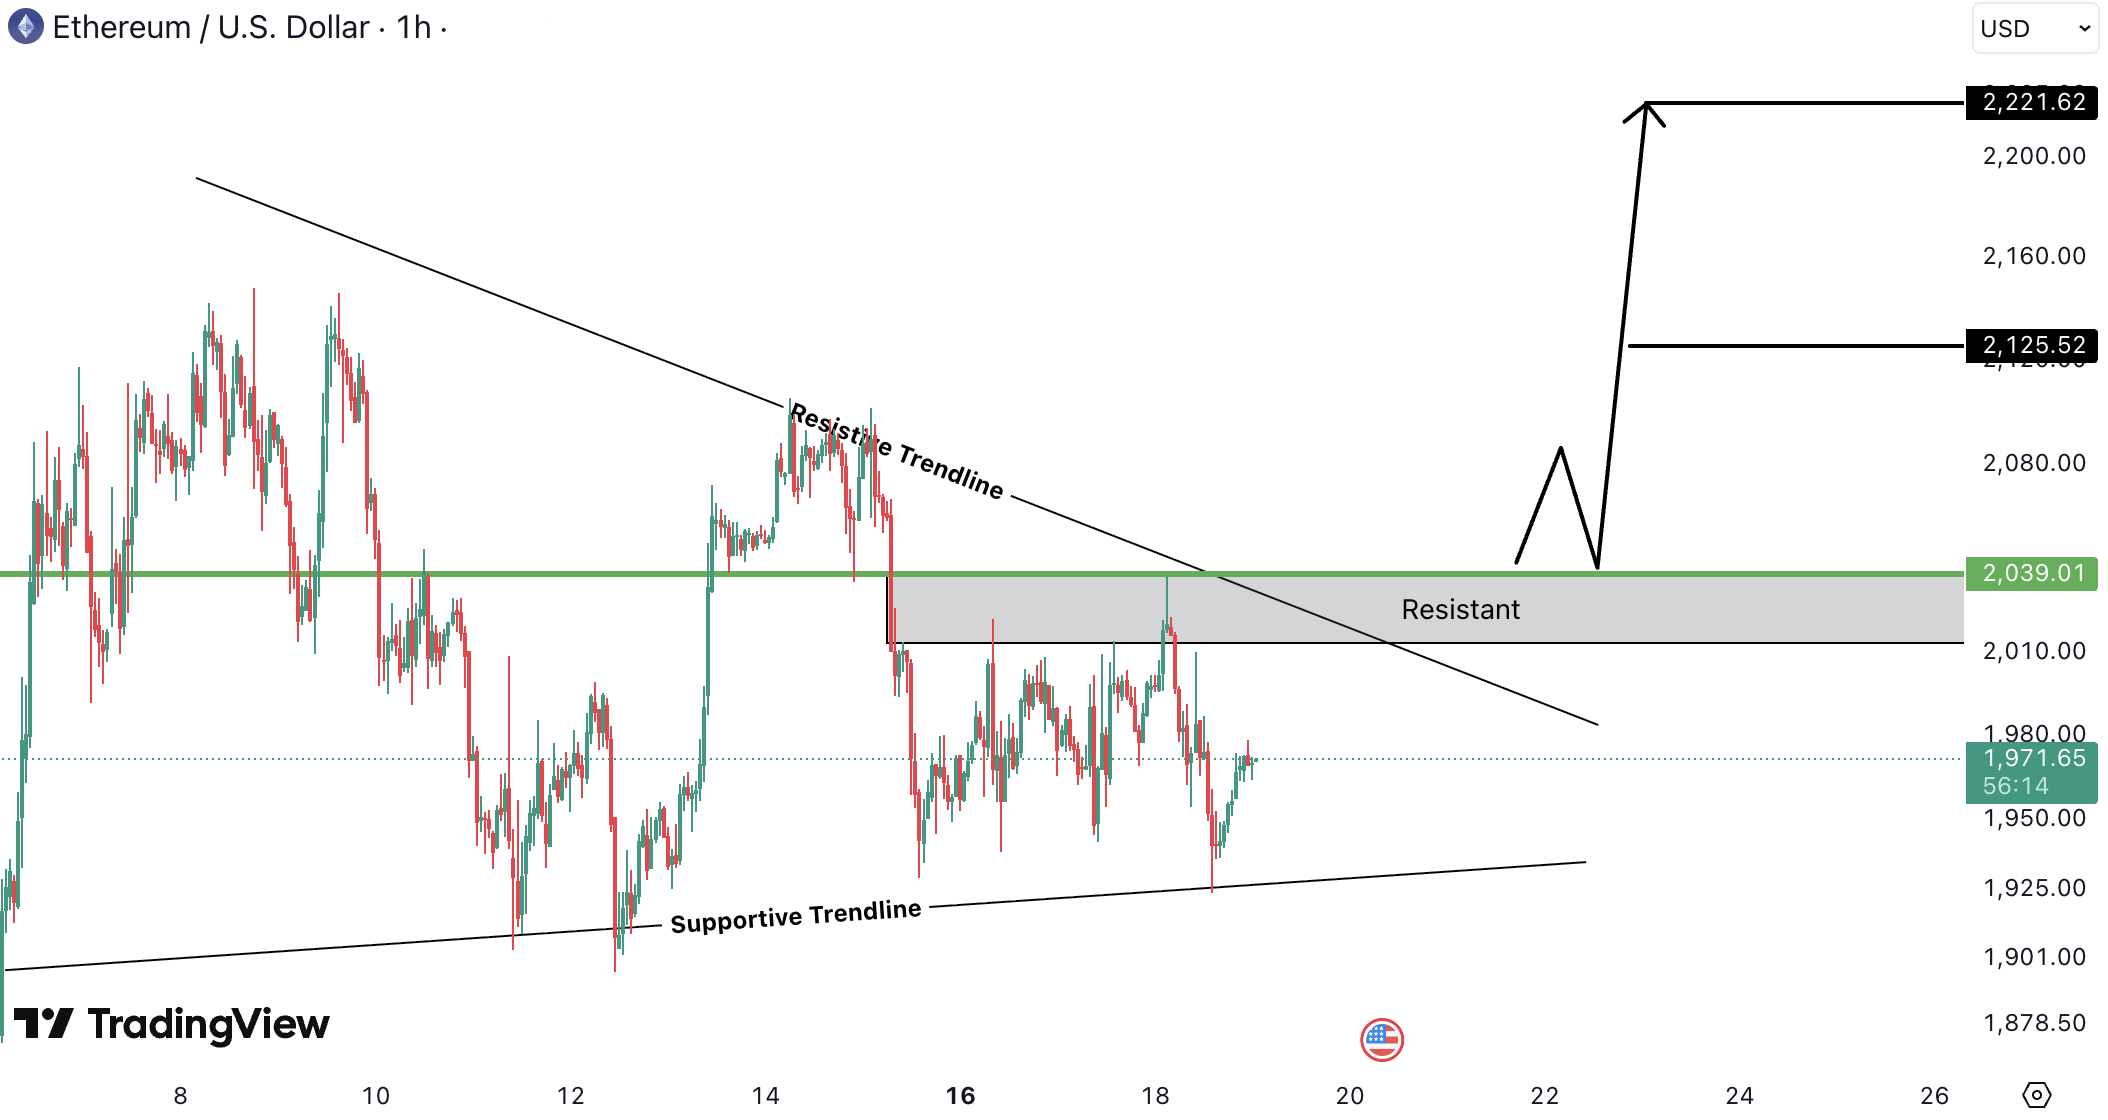
Ethereum (ETH) analysis
ETHUSD on the 1H timeframe is moving within a contracting structure, respecting both a descending resistance trendline and a rising supportive trendline, forming a consolidation phase after the recent decline.
Price is trading around 1,970 USD (1,812.40 EUR) and is struggling to reclaim the key resistance zone near 2,010 – 2,040 USD (1,849.20 – 1,876.80 EUR), which aligns with horizontal resistance and the upper trendline. This area acts as the decision level for the next directional move.
A confirmed breakout and hold above this resistance region would indicate bullish strength and could push price toward upside targets around 2,125 USD (1,955 EUR) and 2,221 USD (2,043.32 EUR). However, failure to break and continued rejection from the trendline may keep Ethereum ranging or lead to another retest of the lower supportive trendline near the 1,930 – 1,900 USD (1,775.60 – 1,748 EUR) area before any major upward expansion.
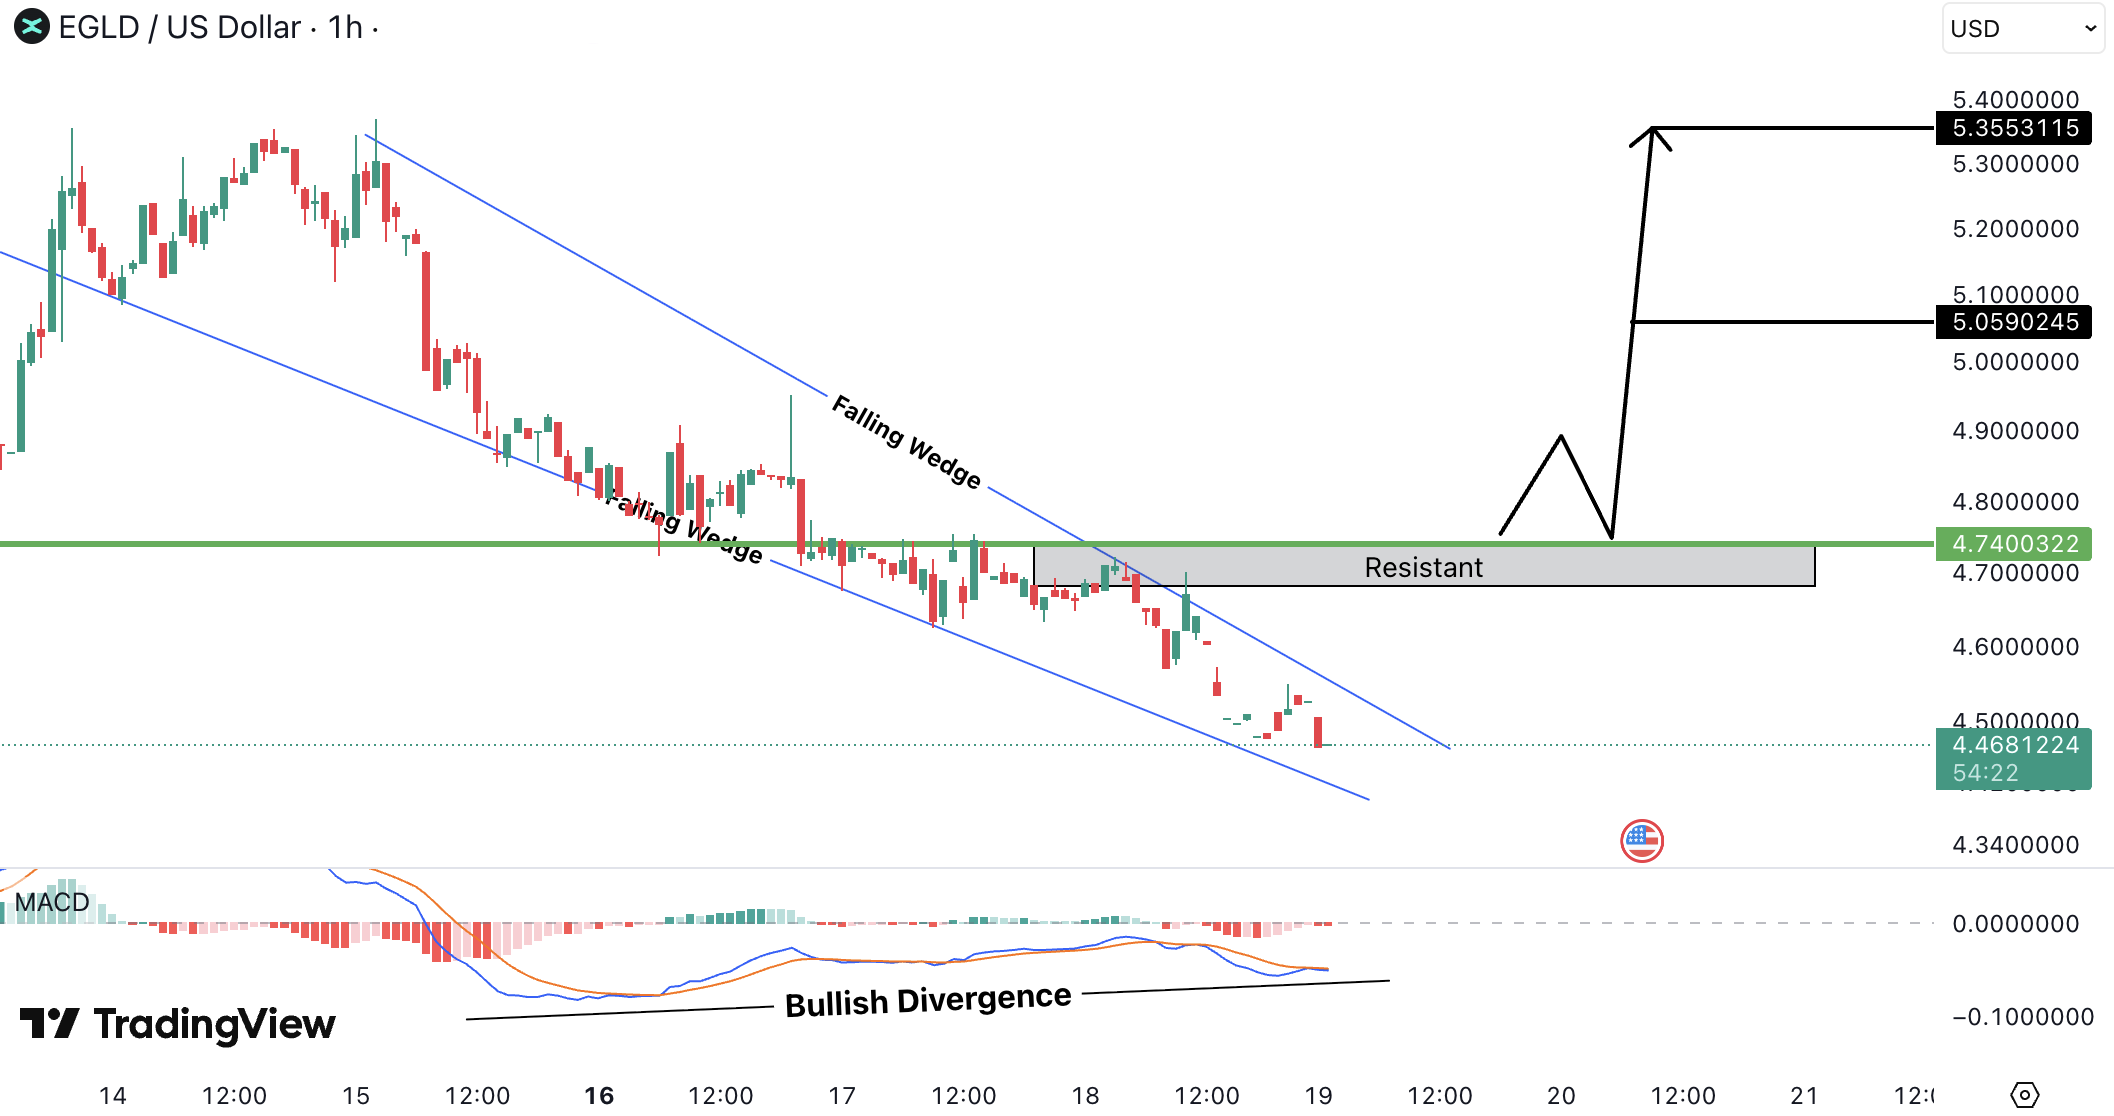
MultiversX (EGLD) analysis
EGLDUSD is trading inside a clear falling wedge structure, with price currently positioned below the highlighted resistance zone around 4.70 – 4.74 USD (4.32 – 4.36 EUR), which has repeatedly acted as a strong supply area.
This resistance also aligns with the upper boundary of the wedge, making it the key level to watch for any bullish reversal. The chart shows bullish divergence on momentum, suggesting that selling pressure is weakening near the recent lows around 4.45 – 4.50 USD (4.09 – 4.14 EUR).
A clean breakout and sustained move above the resistance zone can confirm the wedge breakout and open the path toward upside levels near 5.05 USD (4.65 EUR) and further 5.35 USD (4.92 EUR). Until that zone is reclaimed, price may remain compressed inside the structure, with rejection from resistance keeping the market vulnerable to continued consolidation or minor downside moves.
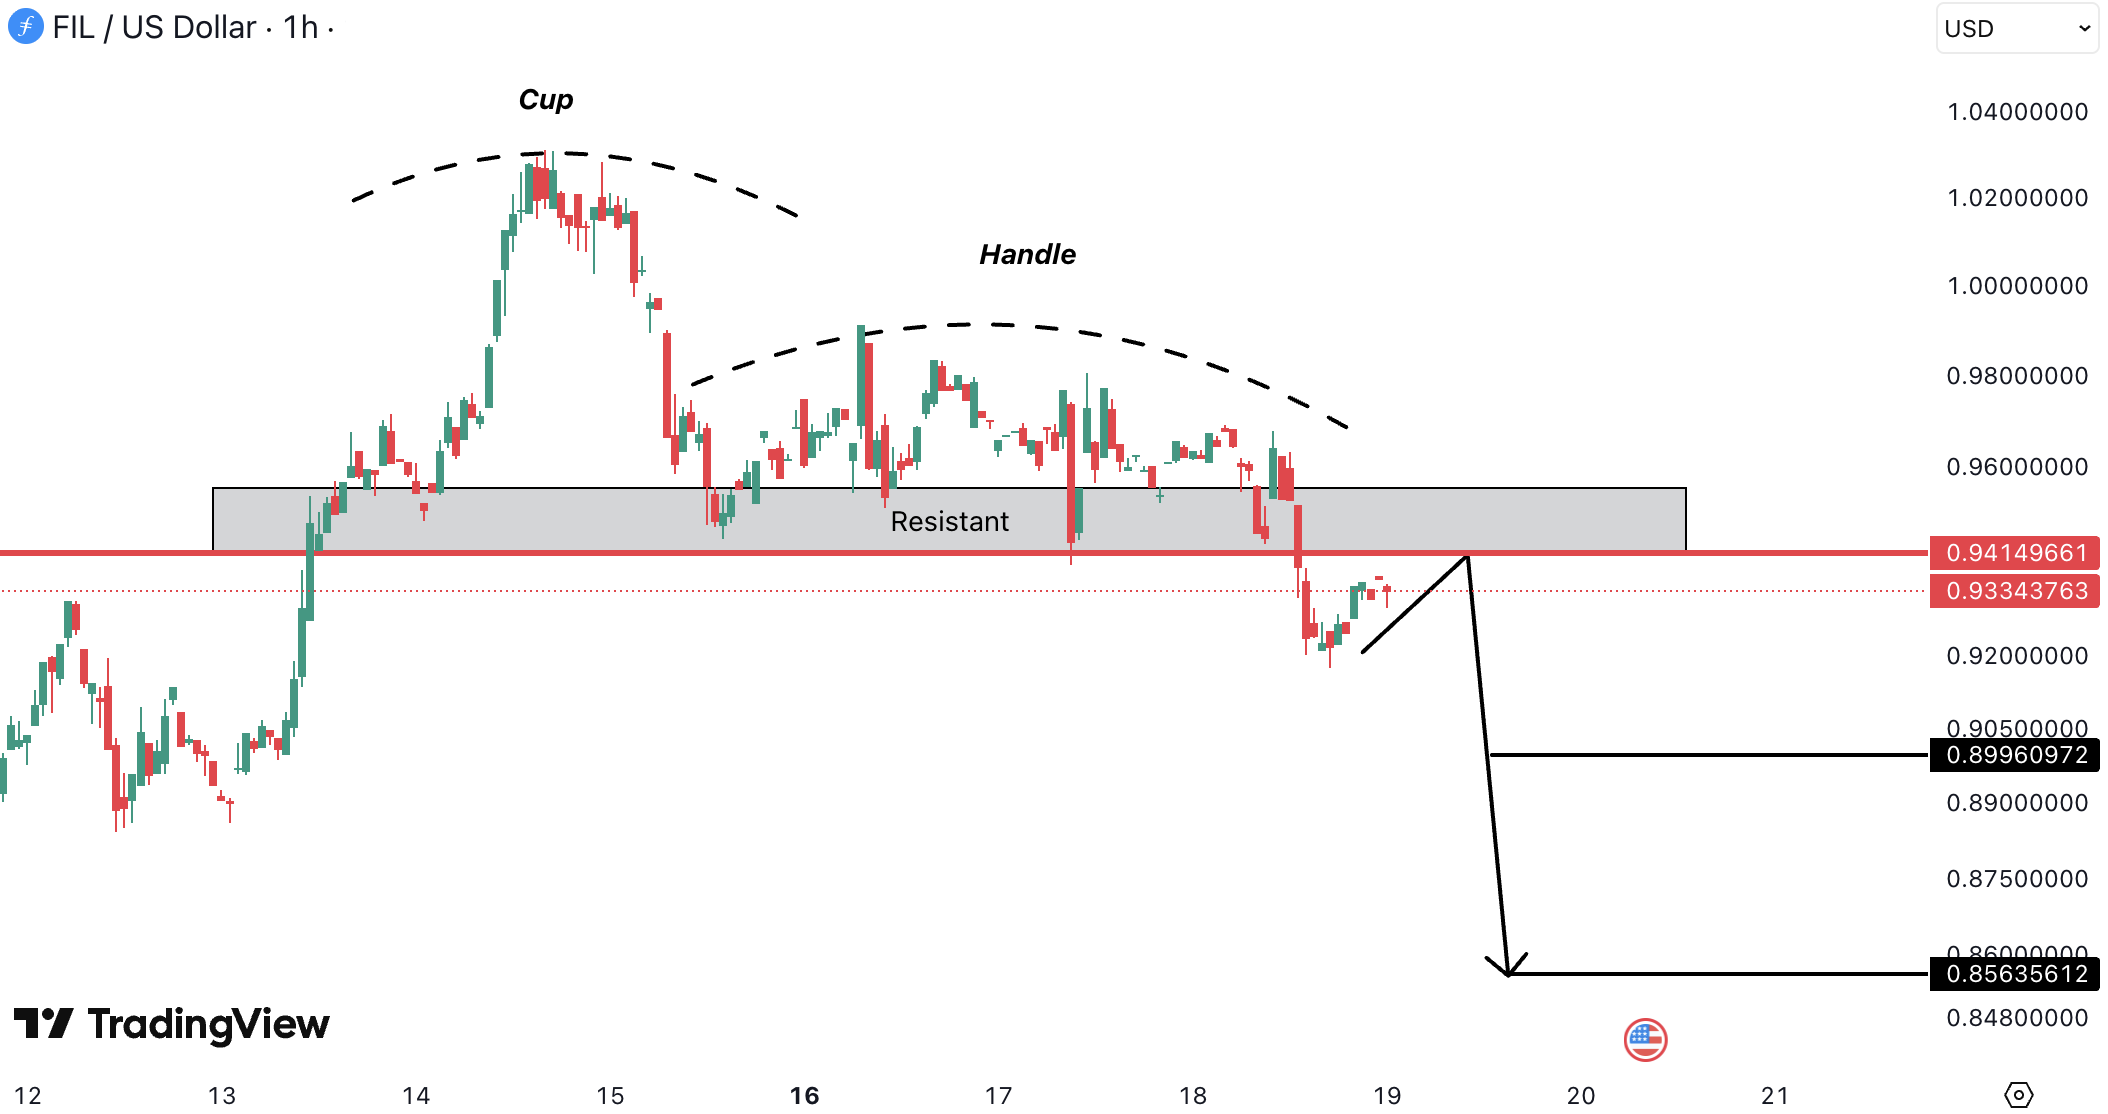
Filecoin (FIL) analysis
FILUSD has broken down from an inverse cup and handle structure and is currently retesting the neckline area around 0.94 – 0.96 USD (0.86 – 0.88 EUR), which is now acting as resistance.
As long as price stays below this zone, the bias remains bearish and sellers may push the market toward 0.90 USD (0.83 EUR) and then 0.86 USD (0.79 EUR). Only a strong reclaim and acceptance above 0.96 USD (0.88 EUR) would invalidate the bearish outlook and signal potential recovery.
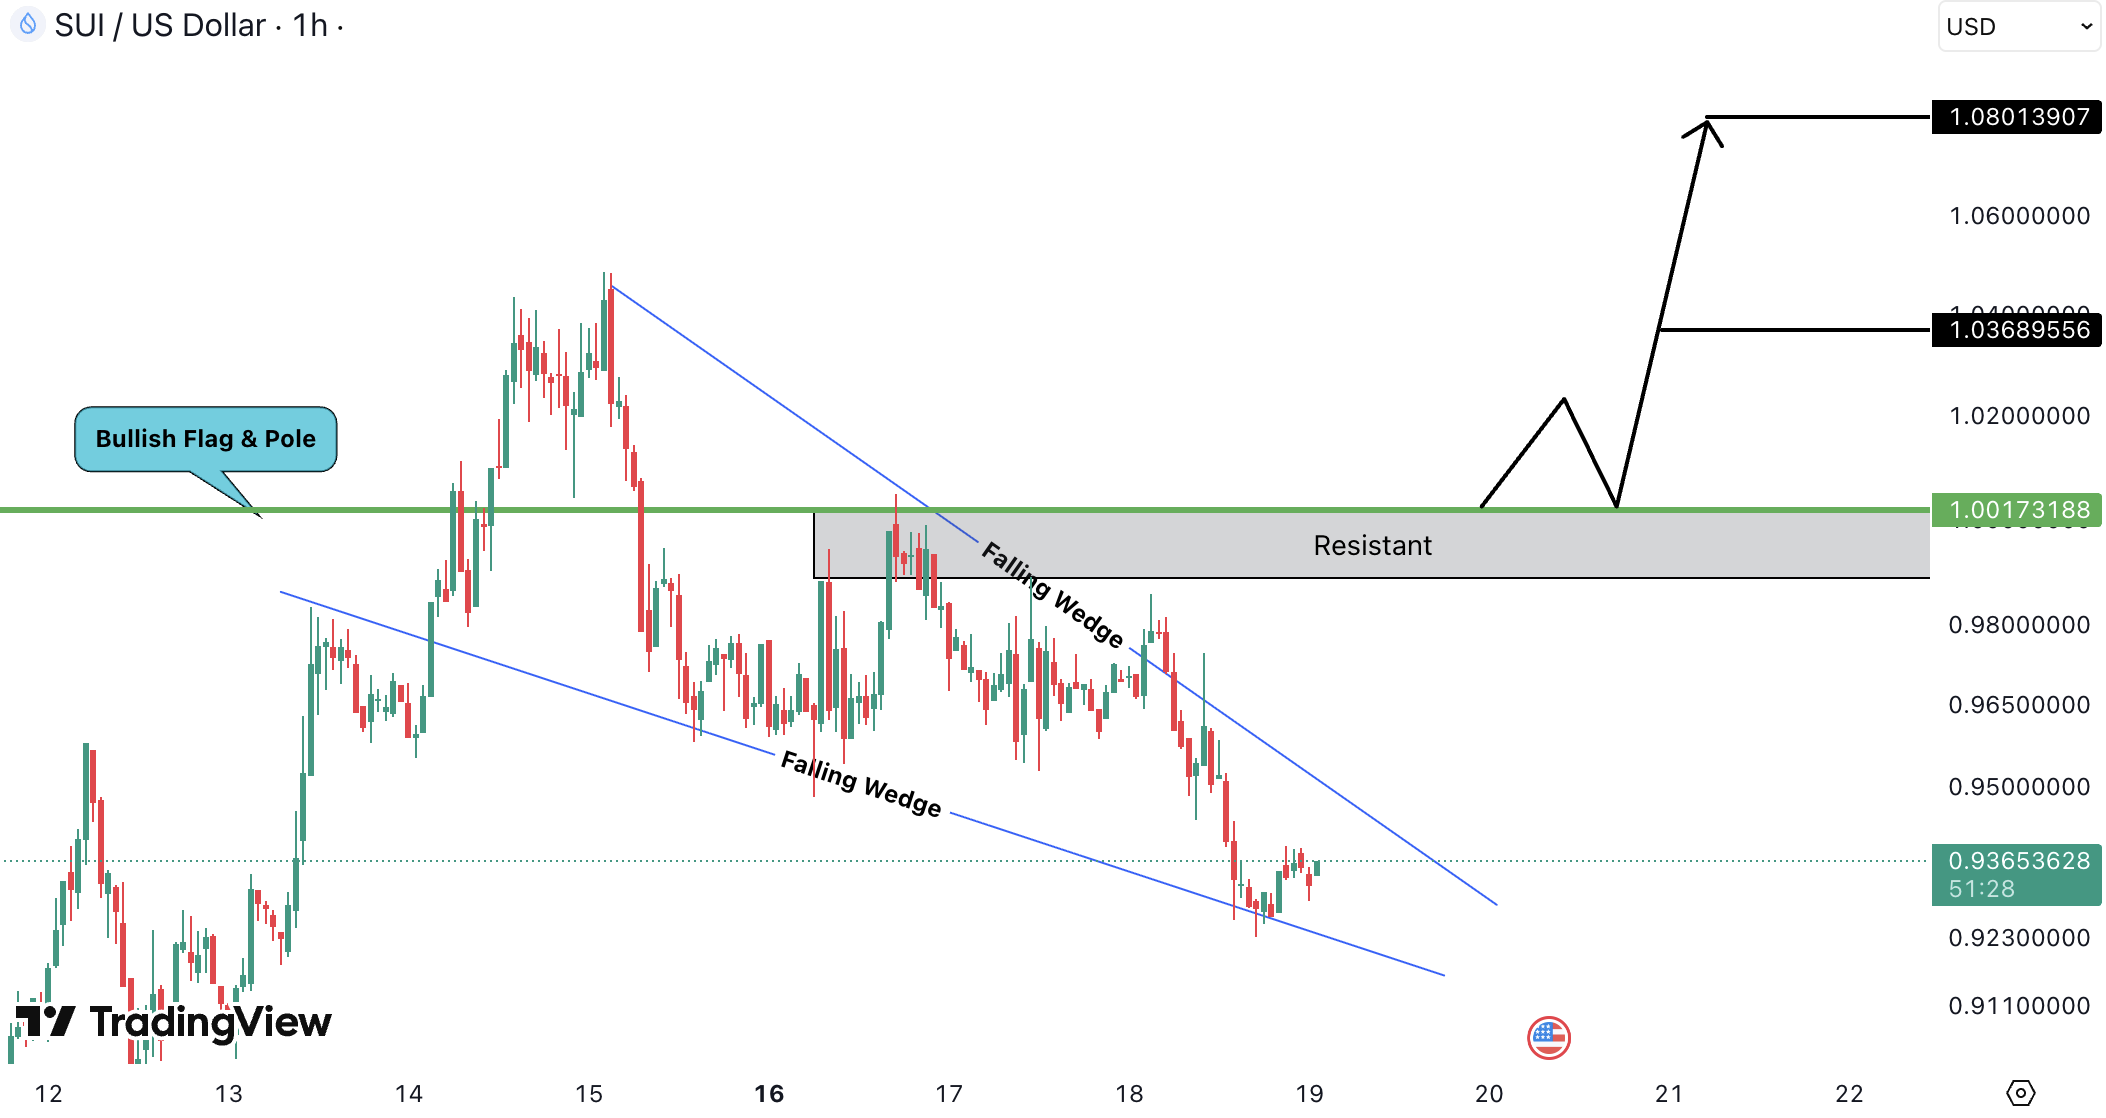
Sui (SUI) analysis
SUIUSD on the 1-hour timeframe is consolidating inside a falling wedge after a strong prior impulsive move, suggesting a corrective phase rather than a full trend reversal.
Price has been compressing toward the lower boundary of the wedge near the 0.92 – 0.94 USD (0.85 – 0.86 EUR) area, while the key resistance remains the horizontal supply zone around 1.00 – 1.01 USD (0.92 – 0.93 EUR), which previously rejected multiple attempts and now acts as the neckline for any bullish continuation.
A decisive breakout from the wedge followed by acceptance above the 1.00 USD (0.92 EUR) region would confirm buyers regaining control and can open upside expansion toward 1.03 USD (0.95 EUR) and later 1.08 USD (0.99 EUR) as projected targets. However, continued rejection below this resistance keeps the structure corrective; failure to hold the lower wedge support would invalidate the bullish setup and likely push price back toward the 0.91 USD (0.84 EUR) liquidity region before any meaningful recovery attempt.
ESTIMATION
BTCUSD – 96H – 1% to 2% – UP – Pullback Expected (But we’re still in bearish trend so it’s risky)
ETHUSD – 96H – 1% to 3% – UP – W pattern
BNBUSD – 96H – 2% to 4% – UP – W Pattern
ALGOUSD – 96H – 2% to 4% – UP – Double bottom
FILUSD – 96H – 2% to 4% – DOWN – Inverse cup & handle