Crypto market evolution in the last 24 hours
🌍 Total market cap: 2.38T USD (↑ 3.37%)
📊 Total volume 24h: 81.12B USD (↑ 77.80%)
🏦 DeFi volume: 8.89B USD (10.96% of total)
💵 Stablecoins volume: 79B USD (97.38% of total)
₿ Bitcoin dominance: 58.49% (↑ 0.34%)
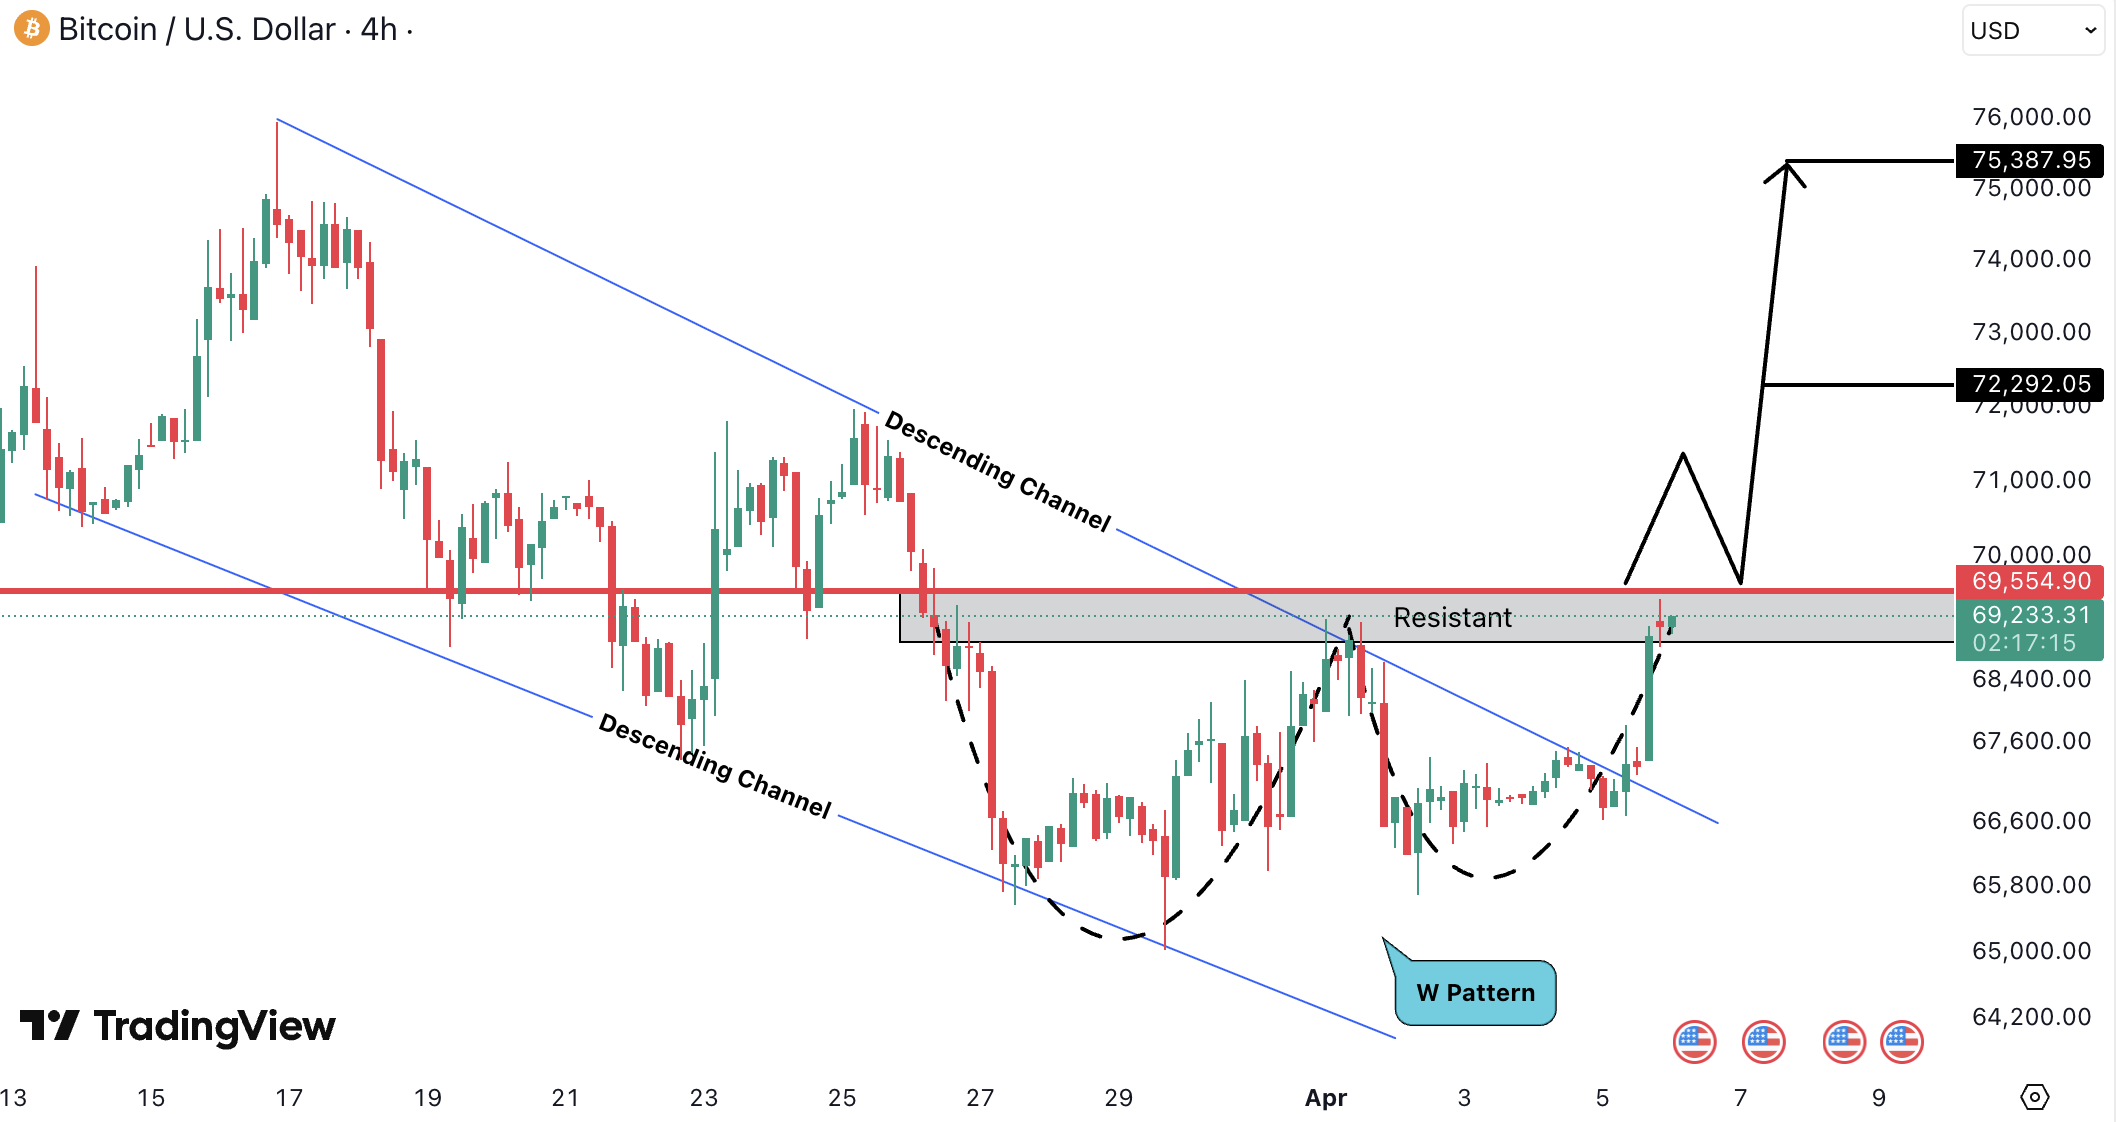
Bitcoin (BTC)
On the 4H timeframe, BTC shows a solid recovery after forming a W pattern near the lower boundary of a descending channel, signaling a shift from bearish to bullish intent. Price has moved back into the key resistance zone around 69,500 USD (approx. 63,940 EUR), acting as a major decision level.
The recent breakout attempt suggests buyers are gaining strength, but confirmation is still needed. A strong close above this level could open the path toward 72,200 USD (approx. 66,420 EUR) and 75,300 USD (approx. 69,270 EUR).
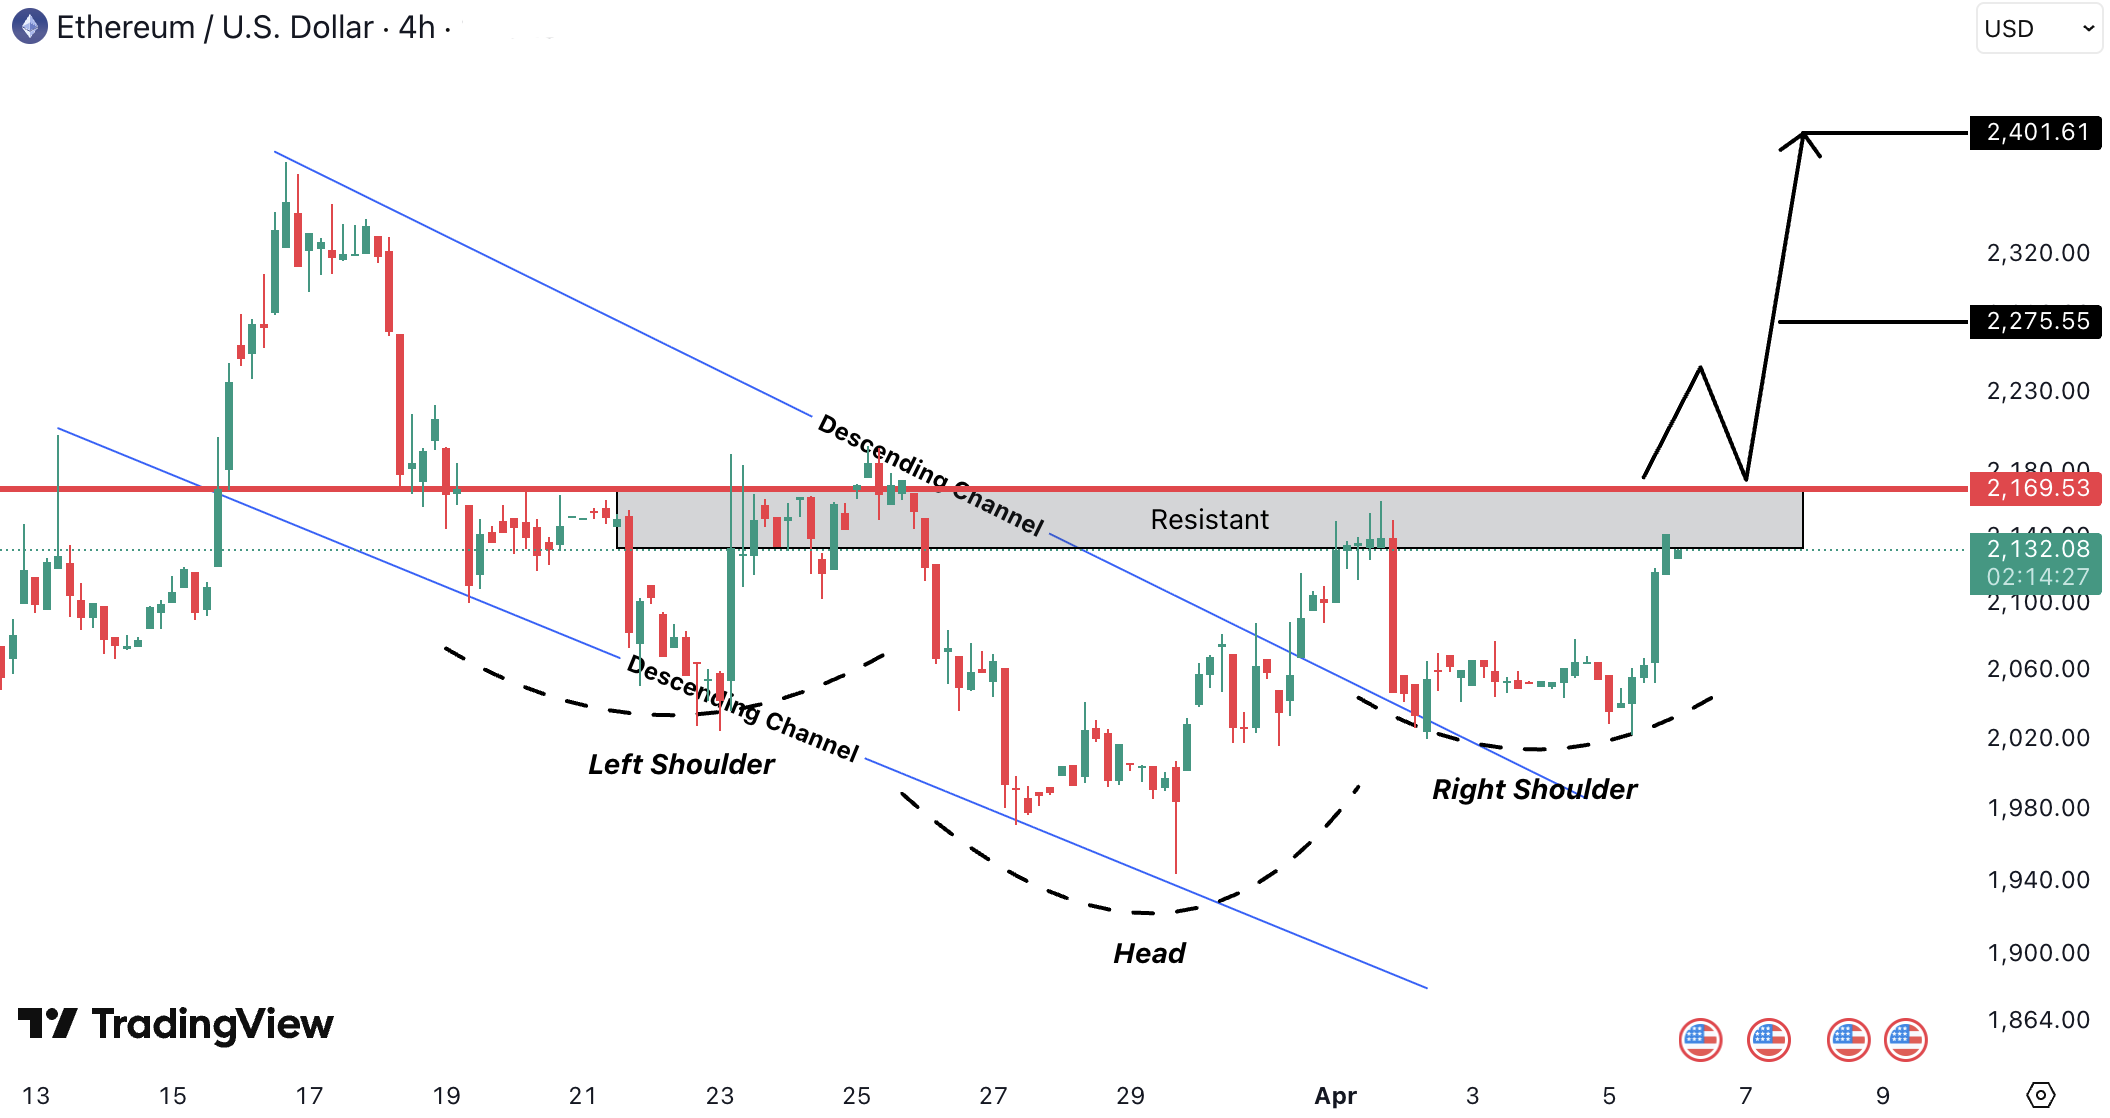
Ethereum (ETH)
On the 4H timeframe, ETH is transitioning out of a descending channel into a potential reversal structure, forming a clear inverse head and shoulders. The right shoulder is complete, and price is now testing the resistance zone around 2,160–2,170 USD (approx. 1,990–2,000 EUR), aligned with the neckline.
This is a key decision level. A clean breakout and hold above it would confirm the bullish reversal and open the way toward 2,275 USD (approx. 2,095 EUR) and 2,400 USD (approx. 2,210 EUR).
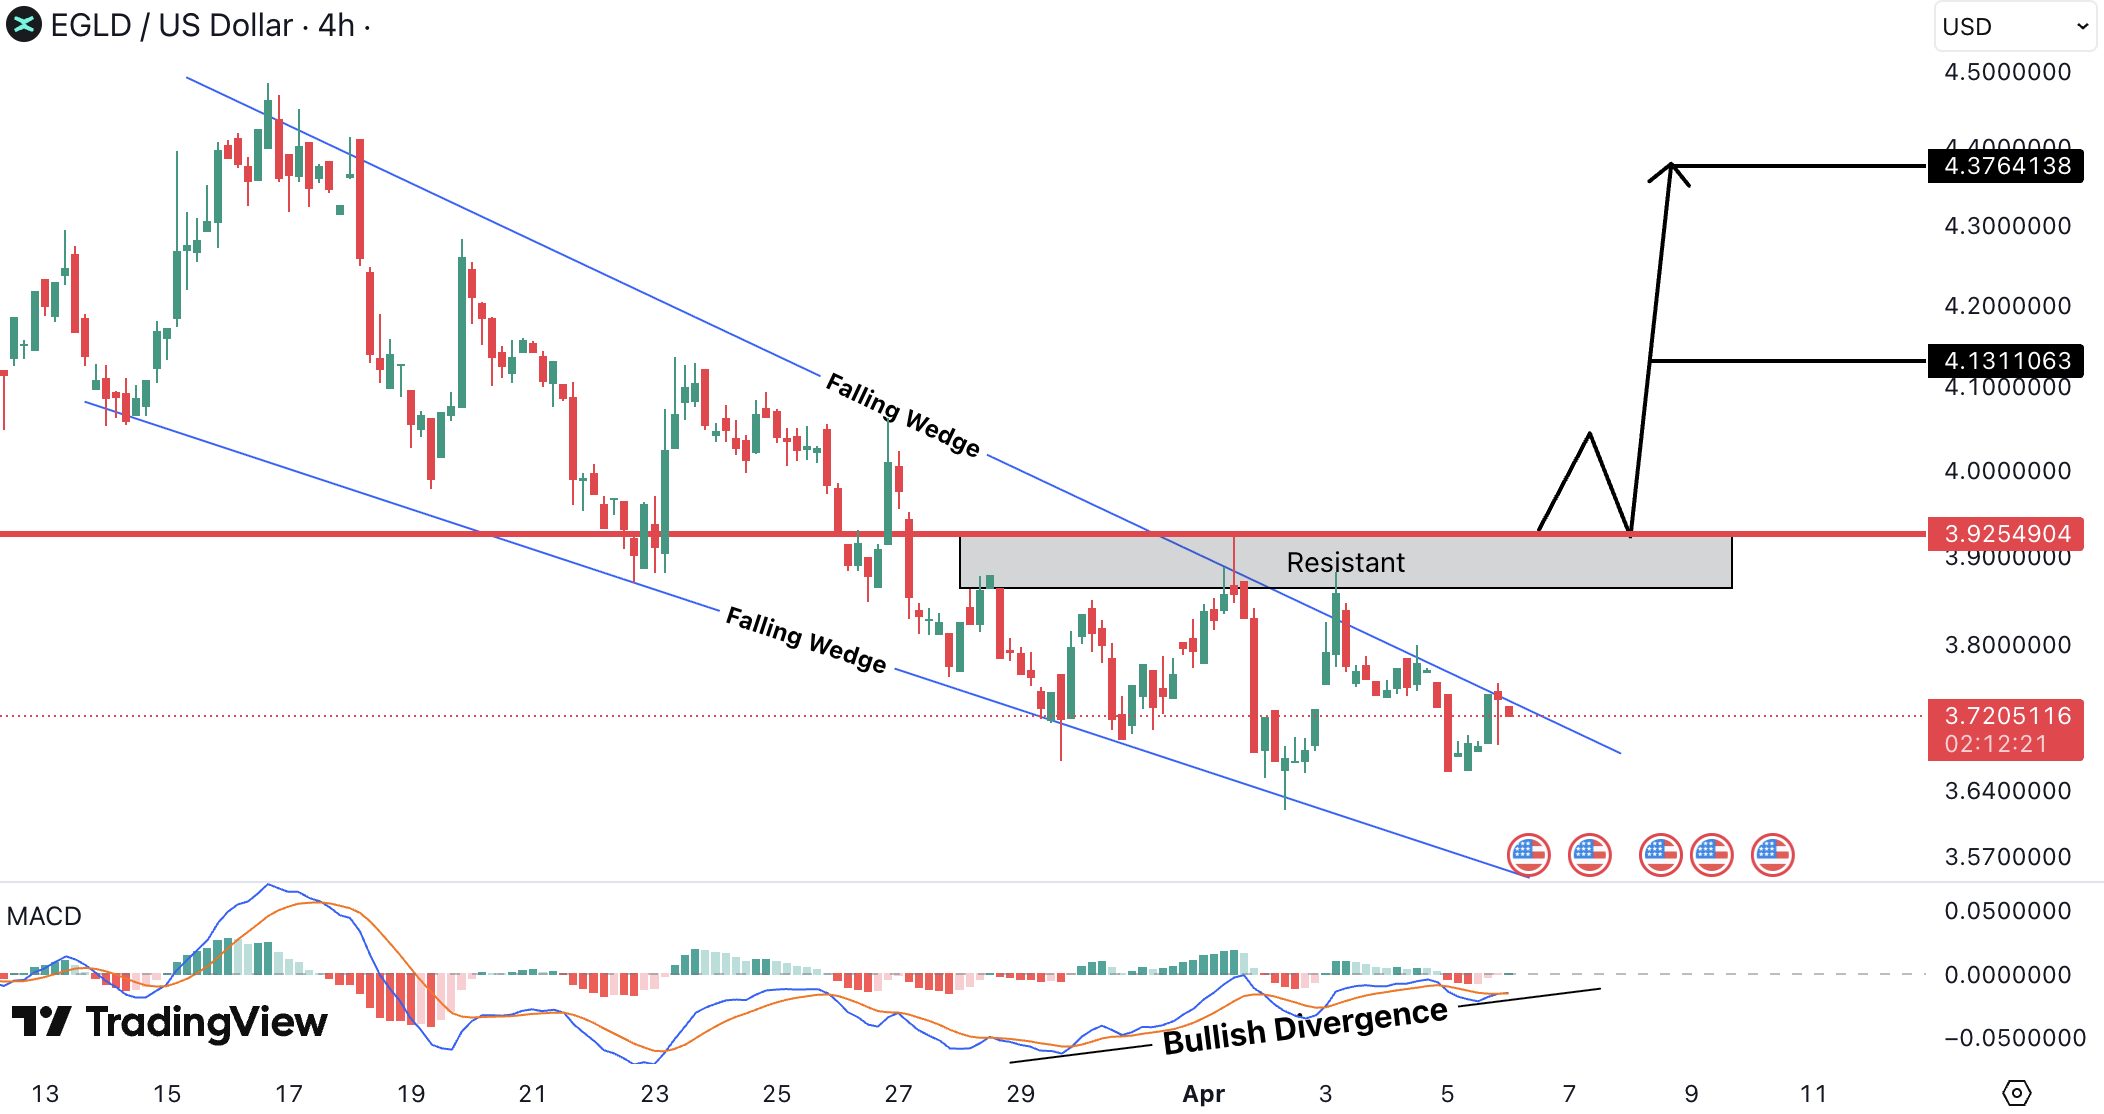
MultiversX (EGLD)
On the 4H timeframe, EGLD is still trading inside a falling wedge. Despite the broader downtrend, momentum is shifting, supported by a clear bullish divergence on MACD.
Price is currently below the key resistance at 3.92 USD (approx. 3.61 EUR), which aligns with the upper boundary of the wedge. This is a critical breakout zone. A strong close above it could trigger a reversal toward 4.13 USD (approx. 3.80 EUR) and 4.37 USD (approx. 4.02 EUR).
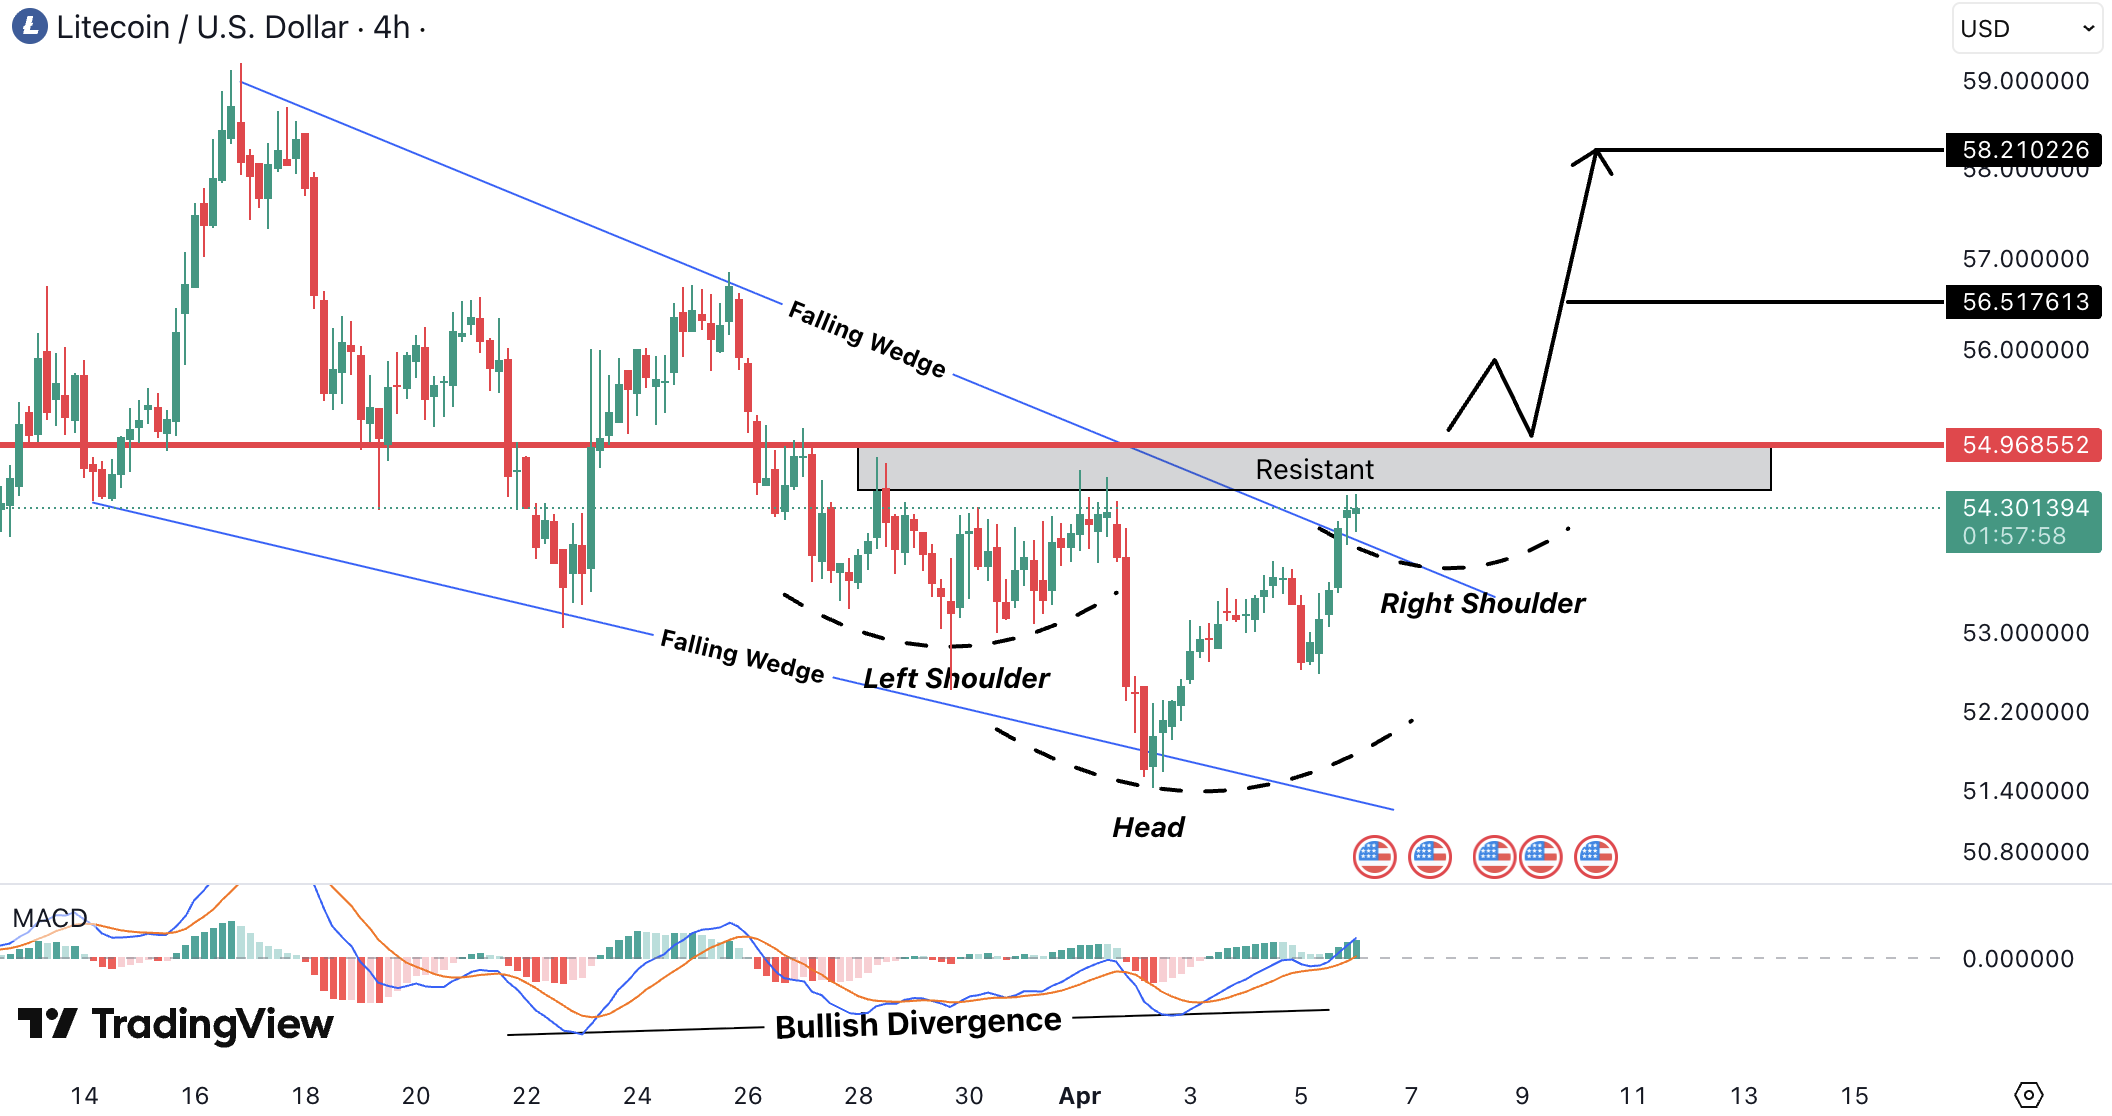
Litecoin (LTC)
On the 4H timeframe, LTC is forming an inverse head and shoulders within a broader falling wedge, suggesting a potential trend reversal.
Price has returned to the resistance zone around 54.9 USD (approx. 50.50 EUR), which also acts as the neckline. The presence of bullish divergence on MACD supports weakening selling pressure.
A breakout and hold above this level could confirm the reversal and push price toward 56.5 USD (approx. 51.97 EUR) and 58.2 USD (approx. 53.54 EUR).
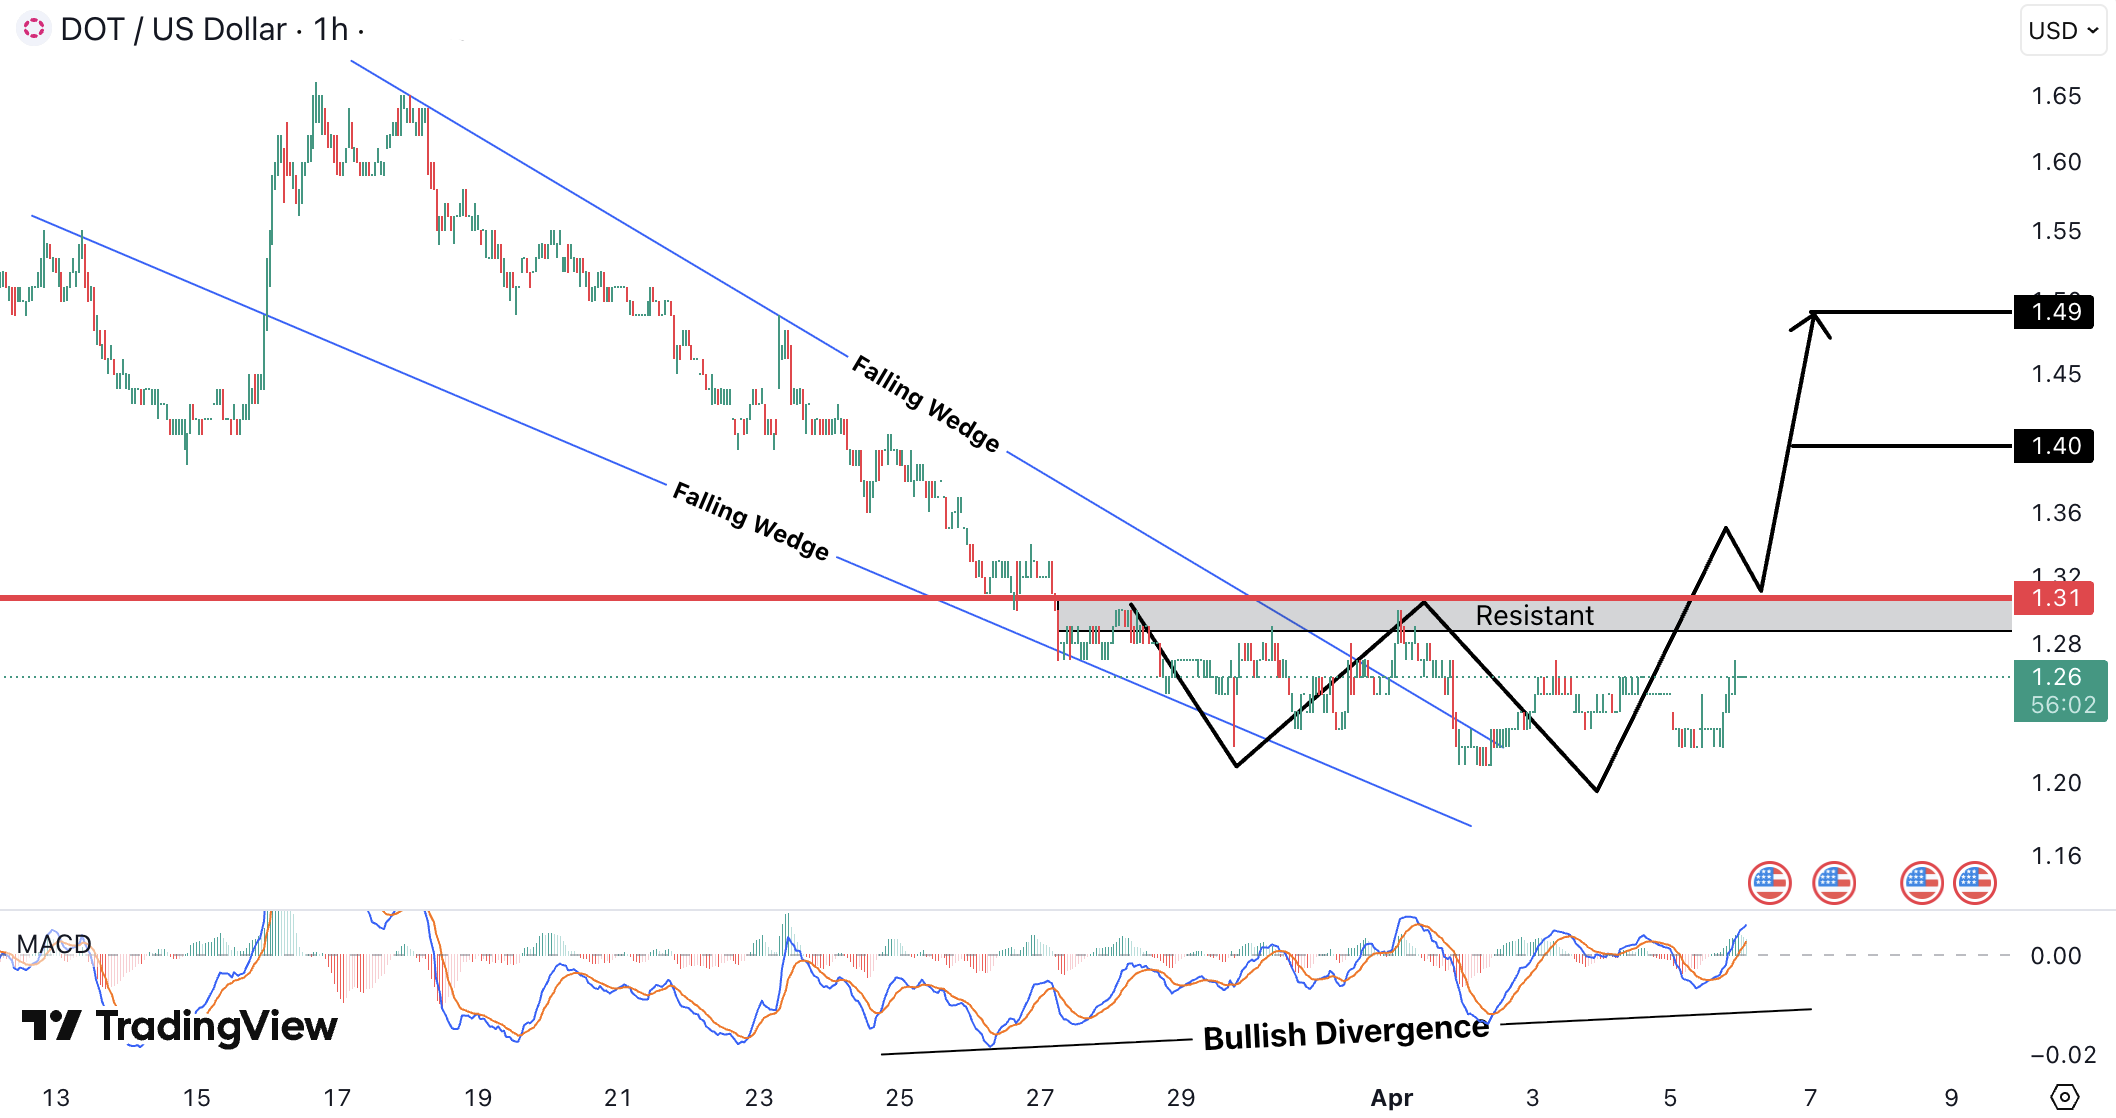
Polkadot (DOT)
On the 1H timeframe, DOT is trading within a falling wedge and starting to show early signs of reversal.
Price is gradually moving toward the 1.31 USD resistance (approx. 1.20 EUR), a key level to watch. At the same time, bullish divergence on MACD suggests selling pressure is fading and buyers are stepping in.
If price breaks and holds above 1.31 USD (approx. 1.20 EUR), it could trigger a move toward 1.40 USD (approx. 1.29 EUR) and 1.49 USD (approx. 1.37 EUR).
ESTIMATION
BTCUSD – 96H – 1% to 2% – UP – Short-term reversal after liquidity taken below, push toward resistance
ETHUSD – 96H – 1% to 3% – UP – Stronger relative momentum, continuation after reclaiming support
EGLDUSD – 96H – 2% to 4% – UP – Reaction from demand zone with accumulation structure
SOLUSD – 96H – 2% to 4% – UP – Bounce from support with bullish divergence
XRPUSD – 96H – 2% to 4% – UP – Range breakout attempt with liquidity sweep confirmation
Limitation of Liability
This report issued by Tradesilvania is purely informative and is not intended to be used as a tool for making investment decisions in crypto-assets. Any person who chooses to use this report in the process of making investment decisions assumes all related risks. Tradesilvania SRL has no legal or other obligation towards the person in question that would derive from the publication of this report publicly.
The content provided on the Tradesilvania website is for informational purposes only and should not be considered as investment advice, financial advice, trading advice, or any other form of advice. We do not endorse or recommend the buying, selling, or holding of any cryptocurrency. It is important that you conduct your own research and consult with a financial advisor before making any investment decisions. We cannot be held responsible for any investment choices made based on the information presented on our website.
The information in this report was obtained from public sources and is considered relevant and reliable within the limits of publicly available data. However, the value of the digital assets referred to in this report fluctuates over time, and past performance does not indicate future growth.