Crypto market evolution in the last 24 hours
🌐 Total crypto market cap: 2.53T USD (↑ +0.82%)
📊 24h total volume: 137.13B USD (↓ -10.24%)
🏦 DeFi volume: 12.16B USD (↓ share 8.86%)
💵 Stablecoins volume: 175.07B USD (↑ share 127.67%)
🟠 BTC dominance: 59.05% (↓ -0.11%)
Bitcoin (BTC)
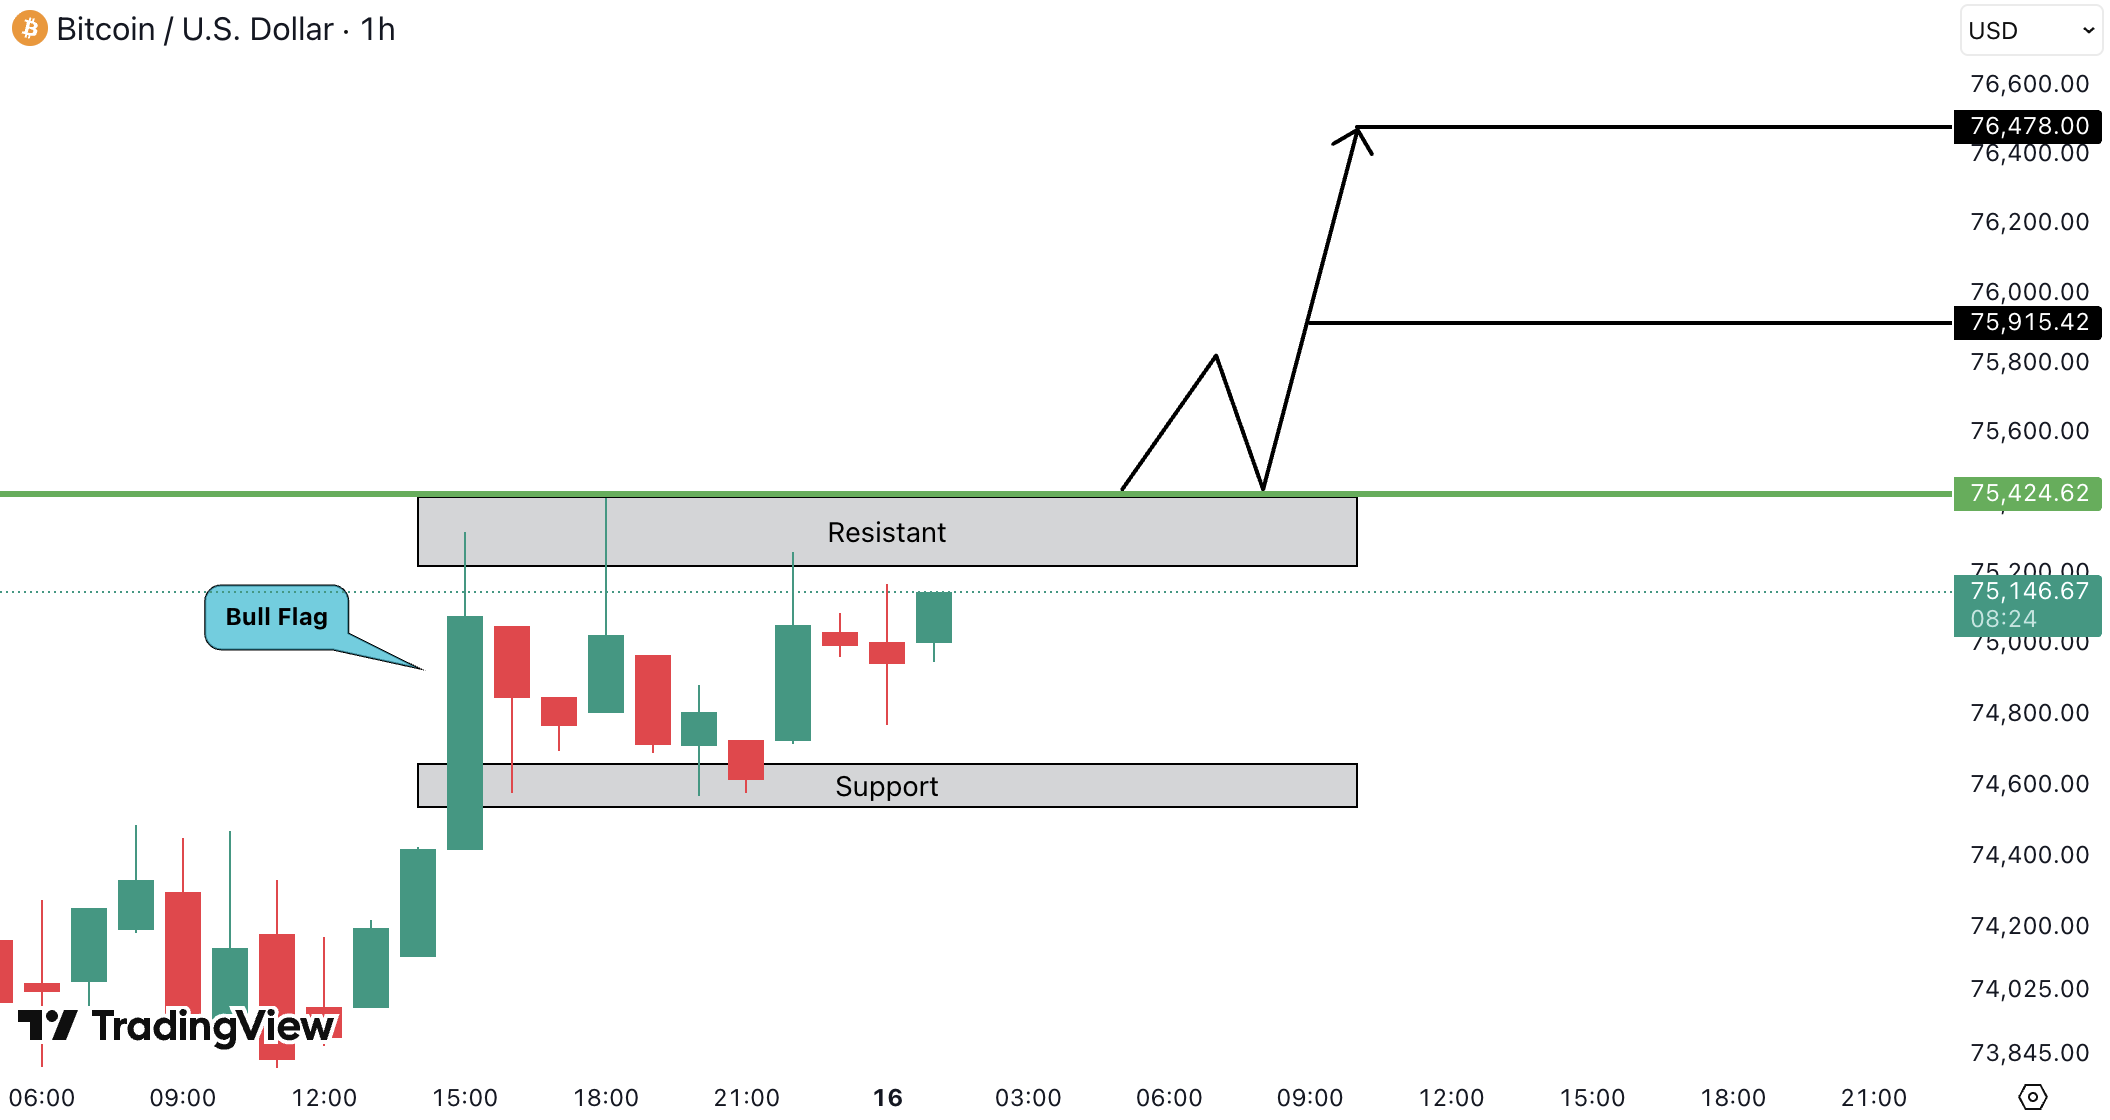
On the 1H timeframe, BTCUSD is showing a bull flag continuation after a strong impulsive move. Price is consolidating above the support zone (~74,600.00 USD / ~68,632.00 EUR – 74,800.00 USD / ~68,816.00 EUR) and starting to push back toward resistance (~75,400.00 USD / ~69,368.00 EUR). The structure remains bullish as long as support holds, and this looks more like accumulation.
A clean breakout above 75,400.00 USD / ~69,368.00 EUR could lead to 75,900.00 USD / ~69,828.00 EUR, followed by a potential extension toward 76,400.00 USD / ~70,288.00 EUR – 76,500.00 USD / ~70,380.00 EUR.
Ethereum (ETH)
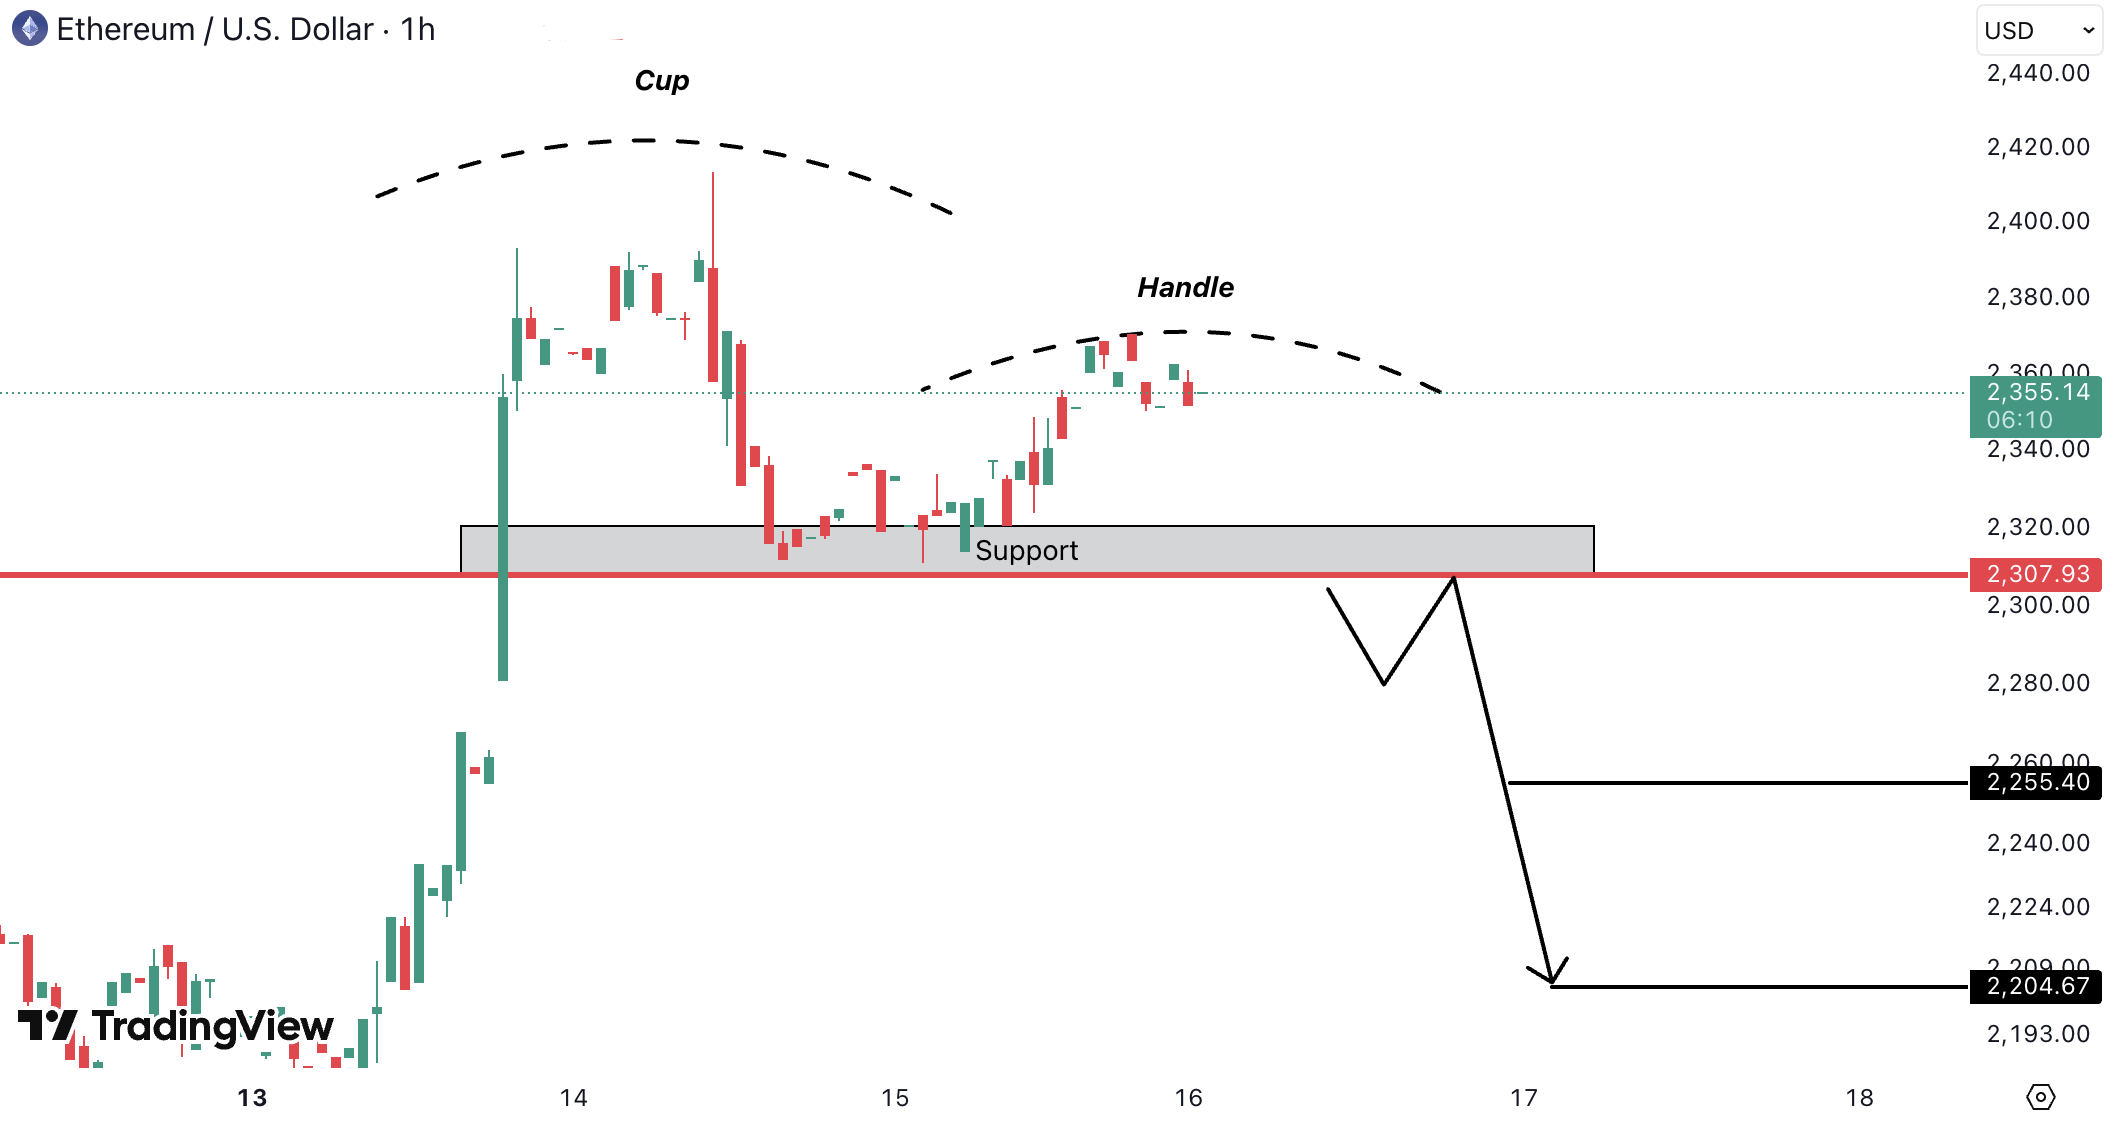
On the 1H timeframe, ETHUSD is forming an inverse cup and handle, where the rounded top suggests distribution and the weak handle shows lack of strength below resistance. Price has already rejected from the highs and is now hovering around the key support at 2,307.00 USD / ~2,122.00 EUR (neckline).
If this level breaks with momentum, downside continuation is likely toward 2,255.00 USD / ~2,074.00 EUR and potentially 2,204.00 USD / ~2,027.00 EUR. Any short-term bounce is likely a lower high unless price reclaims the upper range with strong volume.
MultiversX (EGLD)
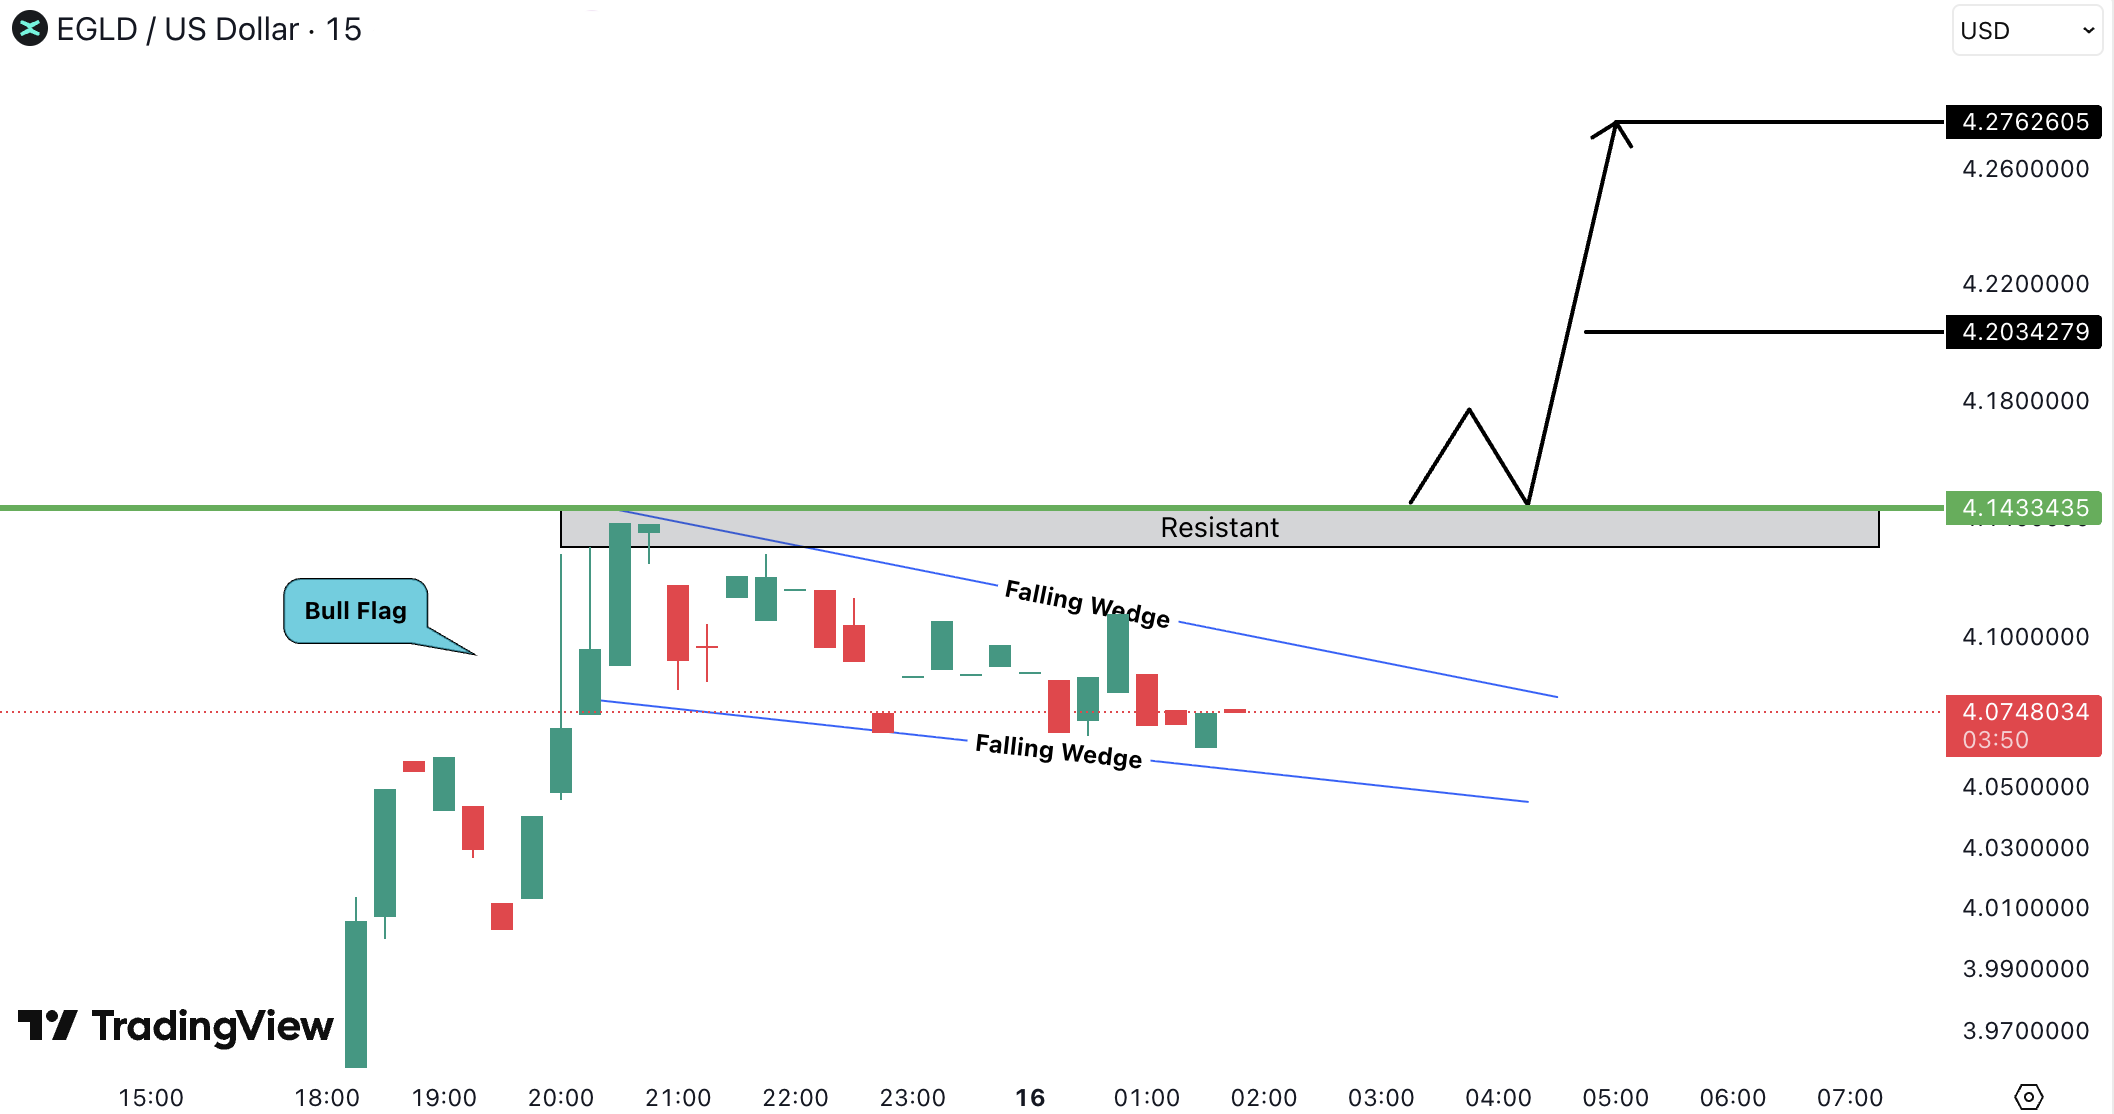
On the 15M timeframe, EGLDUSD shows a bullish continuation setup: a strong impulsive move followed by a bull flag and then a falling wedge, both indicating compression before expansion.
Price is consolidating just below the key resistance at 4.14 USD / ~3.81 EUR, suggesting accumulation. A breakout and hold above this level could trigger a move toward 4.20 USD / ~3.86 EUR and potentially 4.27 USD / ~3.93 EUR. The setup remains valid as long as the wedge structure holds.
Litecoin (LTC)
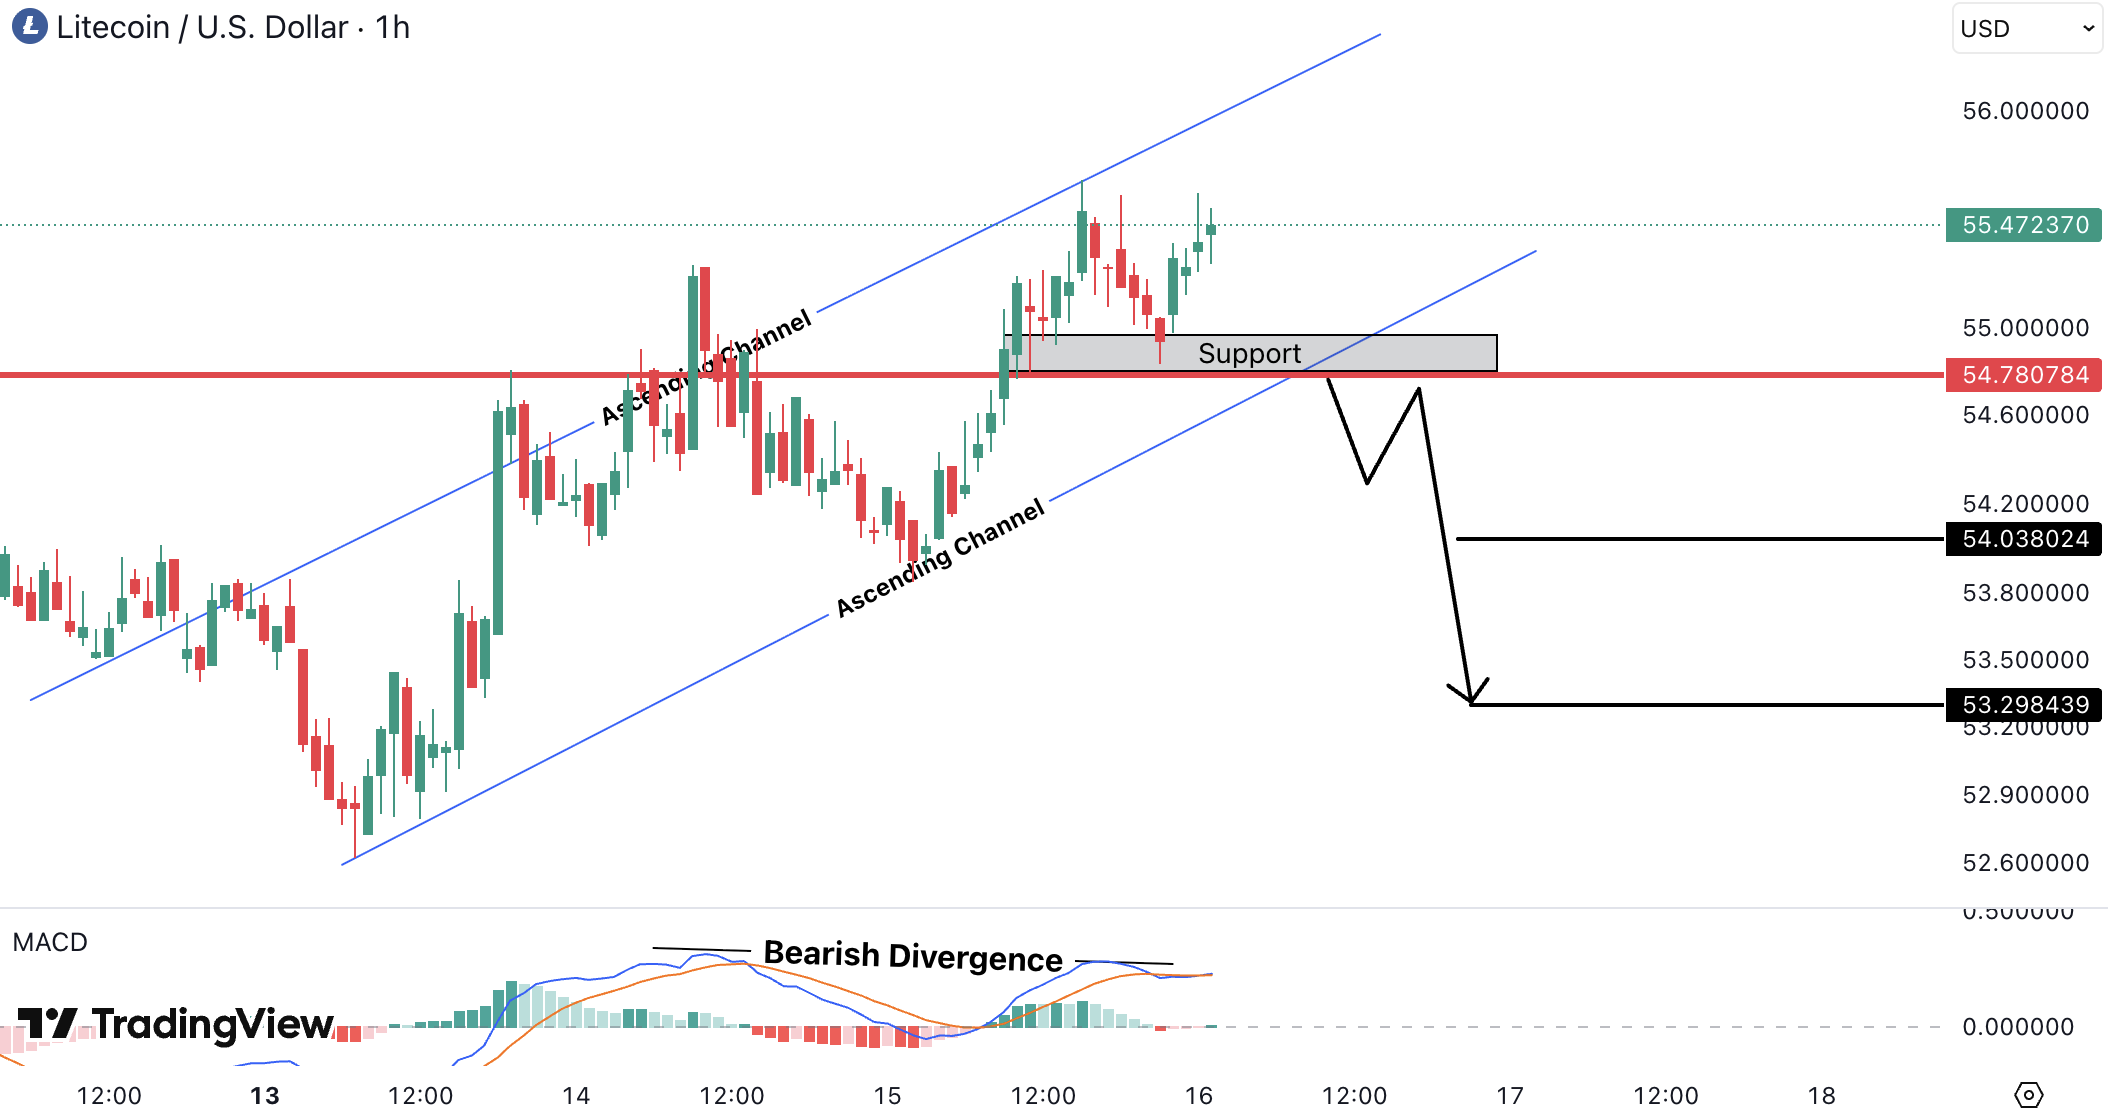
On the 1H timeframe, LTCUSD is trading inside an ascending channel, but showing weakness. There is clear bearish divergence on MACD, indicating slowing momentum despite higher highs.
Price is reacting near the upper boundary while holding above 54.70 USD / ~50.32 EUR support. If this level breaks, it could trigger a move toward 54.03 USD / ~49.71 EUR and then 53.29 USD / ~49.03 EUR.
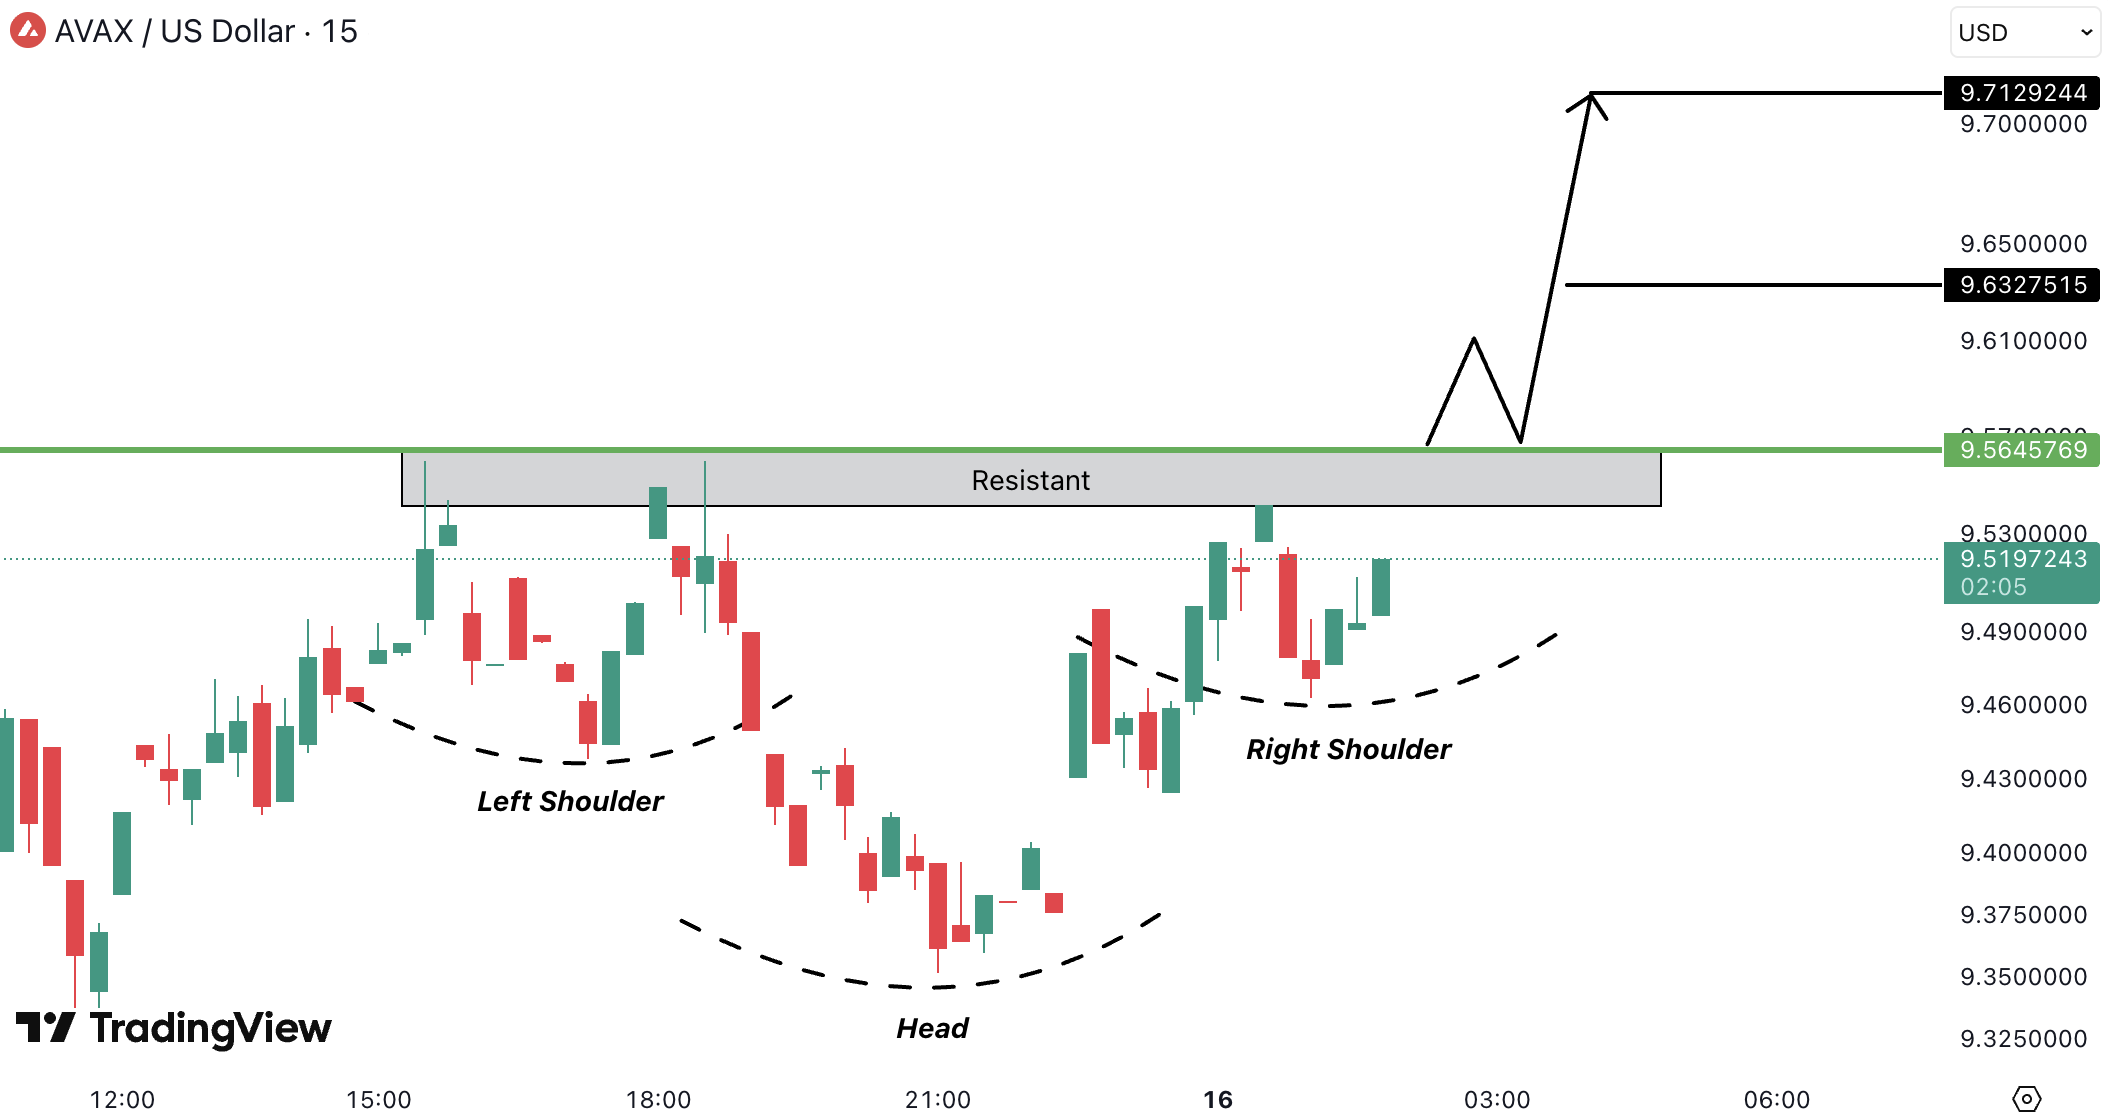
Avalanche (AVAX)
On the 15M timeframe, AVAXUSD is forming an inverse head and shoulders, with the right shoulder developing below the neckline (~9.56 USD / ~8.80 EUR). The structure suggests accumulation, and higher lows indicate buyer interest.
A breakout and hold above the neckline could trigger continuation toward 9.63 USD / ~8.86 EUR, with potential extension to 9.71 USD / ~8.93 EUR.
Estimation (96H)
- BTCUSD: +1% to +2% | UP | Holding support, liquidity building above highs
- ETHUSD: +1% to +3% | UP | Strong relative momentum, higher lows
- EGLDUSD: +2% to +4% | UP | Accumulation near demand, breakout potential
- SOLUSD: +2% to +4% | UP | Bounce from support, bullish continuation
- AVAXUSD: +2% to +4% | UP | Compression with breakout potential