Crypto market evolution in the last 24 hours
🌍 Global crypto market cap: 2.59T USD (↓ 1.15%)
📊 Total 24h volume: 147.04B USD (↓ 1.14%)
🏦 DeFi volume: 11.87B USD (8.08% of total)
💵 Stablecoins volume: 188.38B USD (128.12% of total)
₿ Bitcoin dominance: 60.05% (↑ 0.24%)
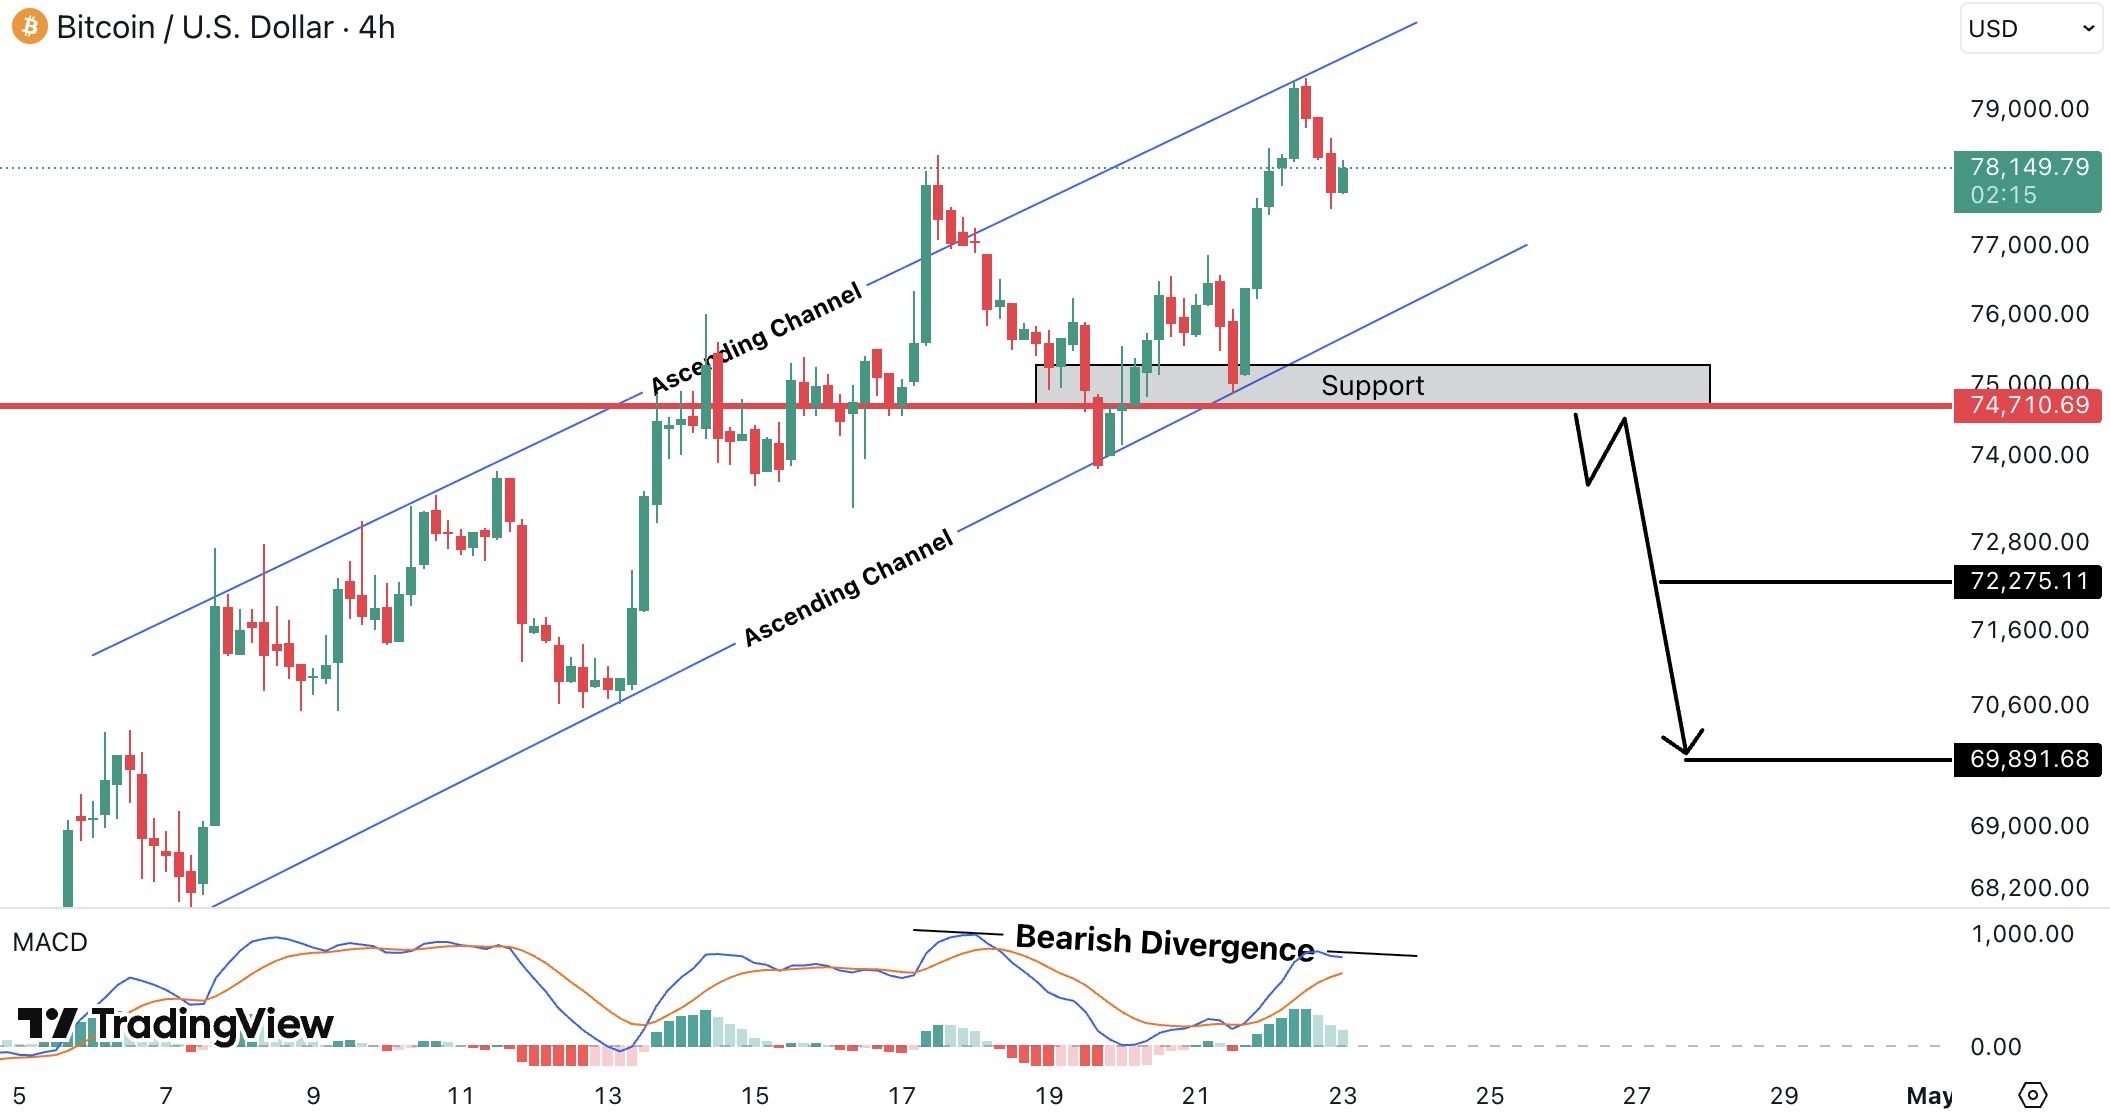
Bitcoin (BTC)
On the 4H timeframe, BTC is showing signs of trend exhaustion, with price rejecting from the upper boundary of an ascending channel, while bearish divergence on MACD confirms weakening momentum.
Price is currently hovering near the support zone at 74,700 USD (~68,724 EUR), which is a critical level. Holding this level could lead to a short-term bounce, while a clean breakdown would likely confirm a shift in structure.
If support fails, downside targets are:
- 72,200 USD (~66,424 EUR)
- 69,800 USD (~64,216 EUR)
These levels align with the projected move after a channel breakdown.
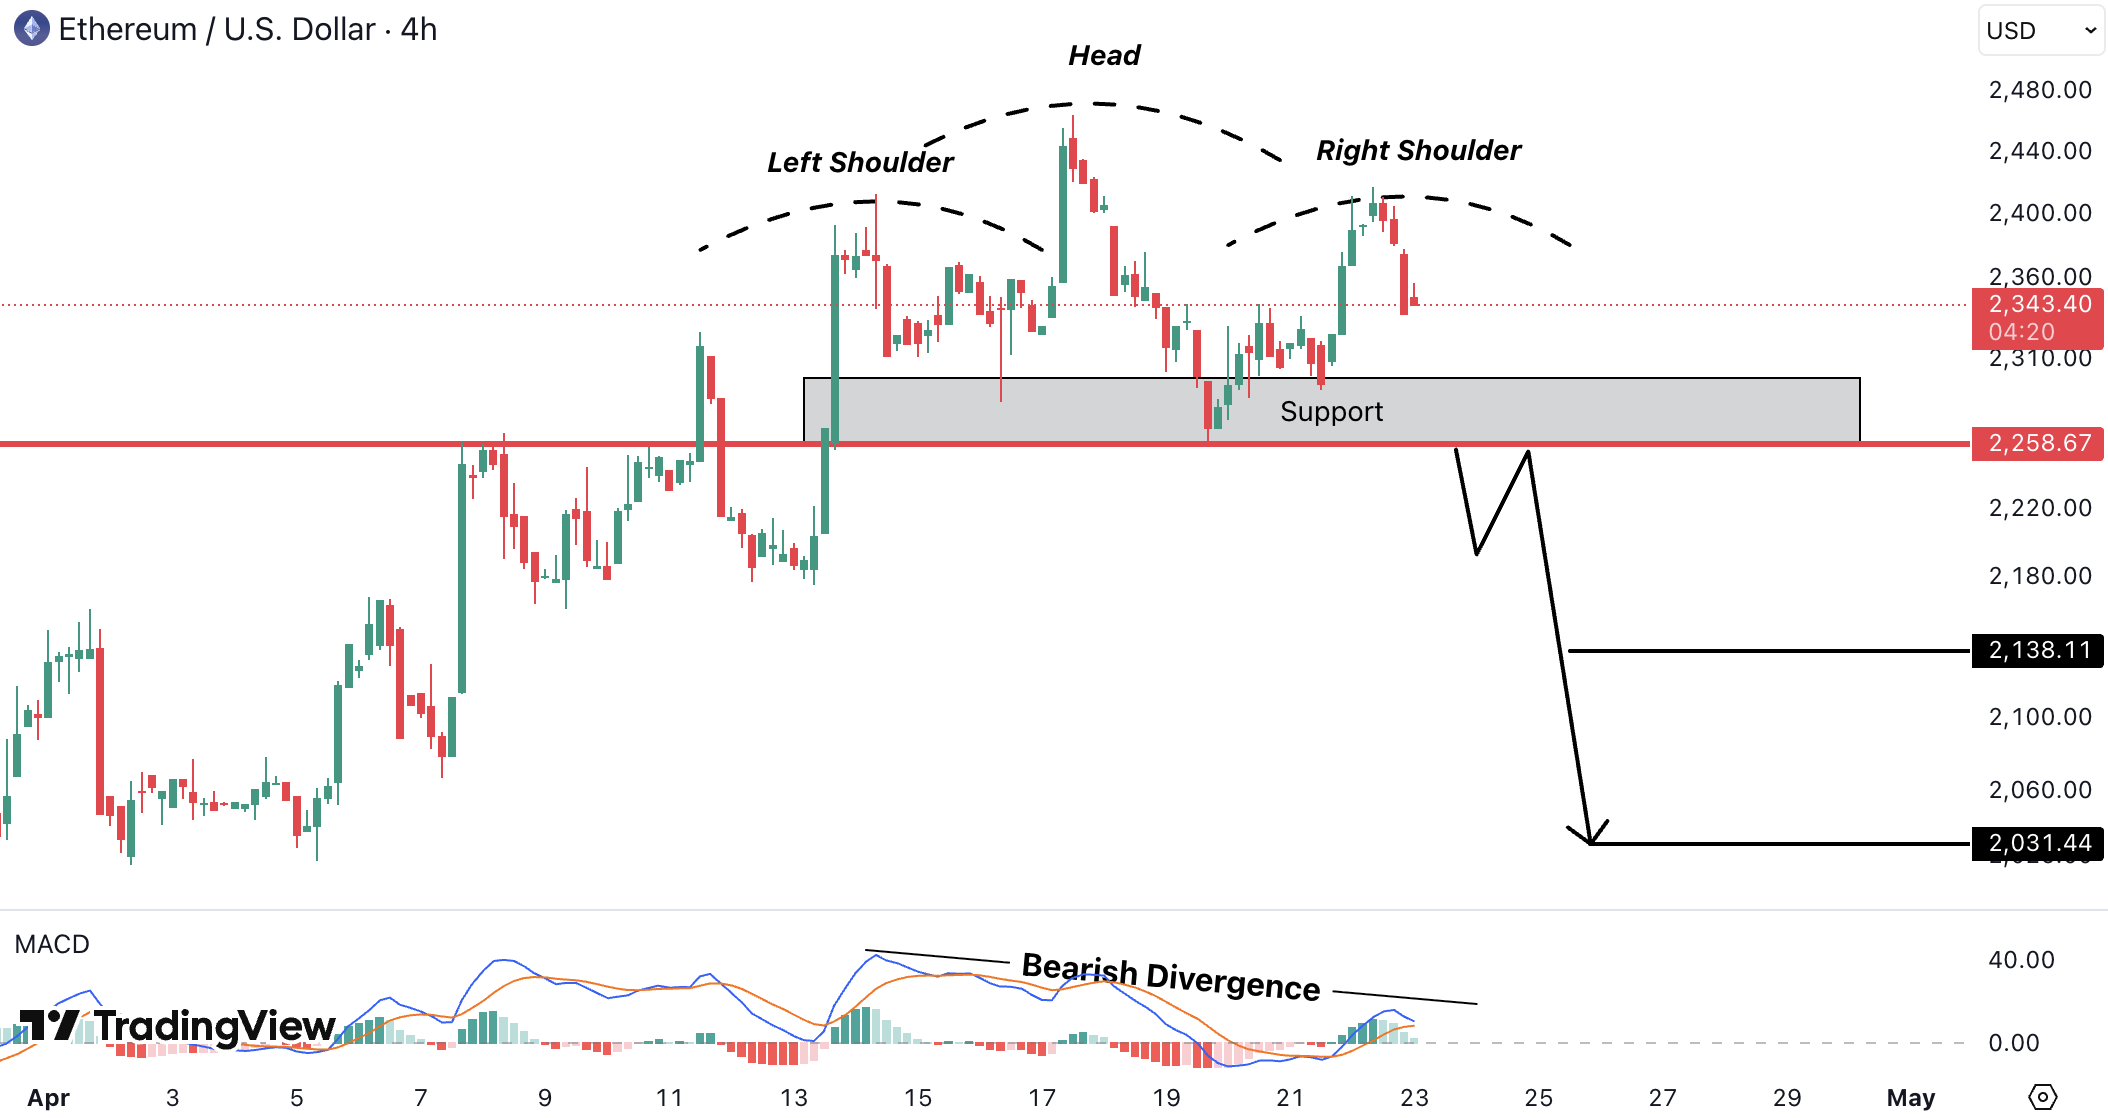
Ethereum (ETH)
On the 4H timeframe, ETH is forming a clear head and shoulders pattern. The right shoulder has already rejected lower, while bearish divergence on MACD confirms weakening momentum.
Price is currently holding above the key neckline support around 2,250 – 2,260 USD (~2,070 – 2,079 EUR), making this a critical level.
A clean breakdown would confirm the pattern and likely trigger a downside move toward:
- 2,138 USD (~1,967 EUR)
- 2,030 USD (~1,868 EUR)
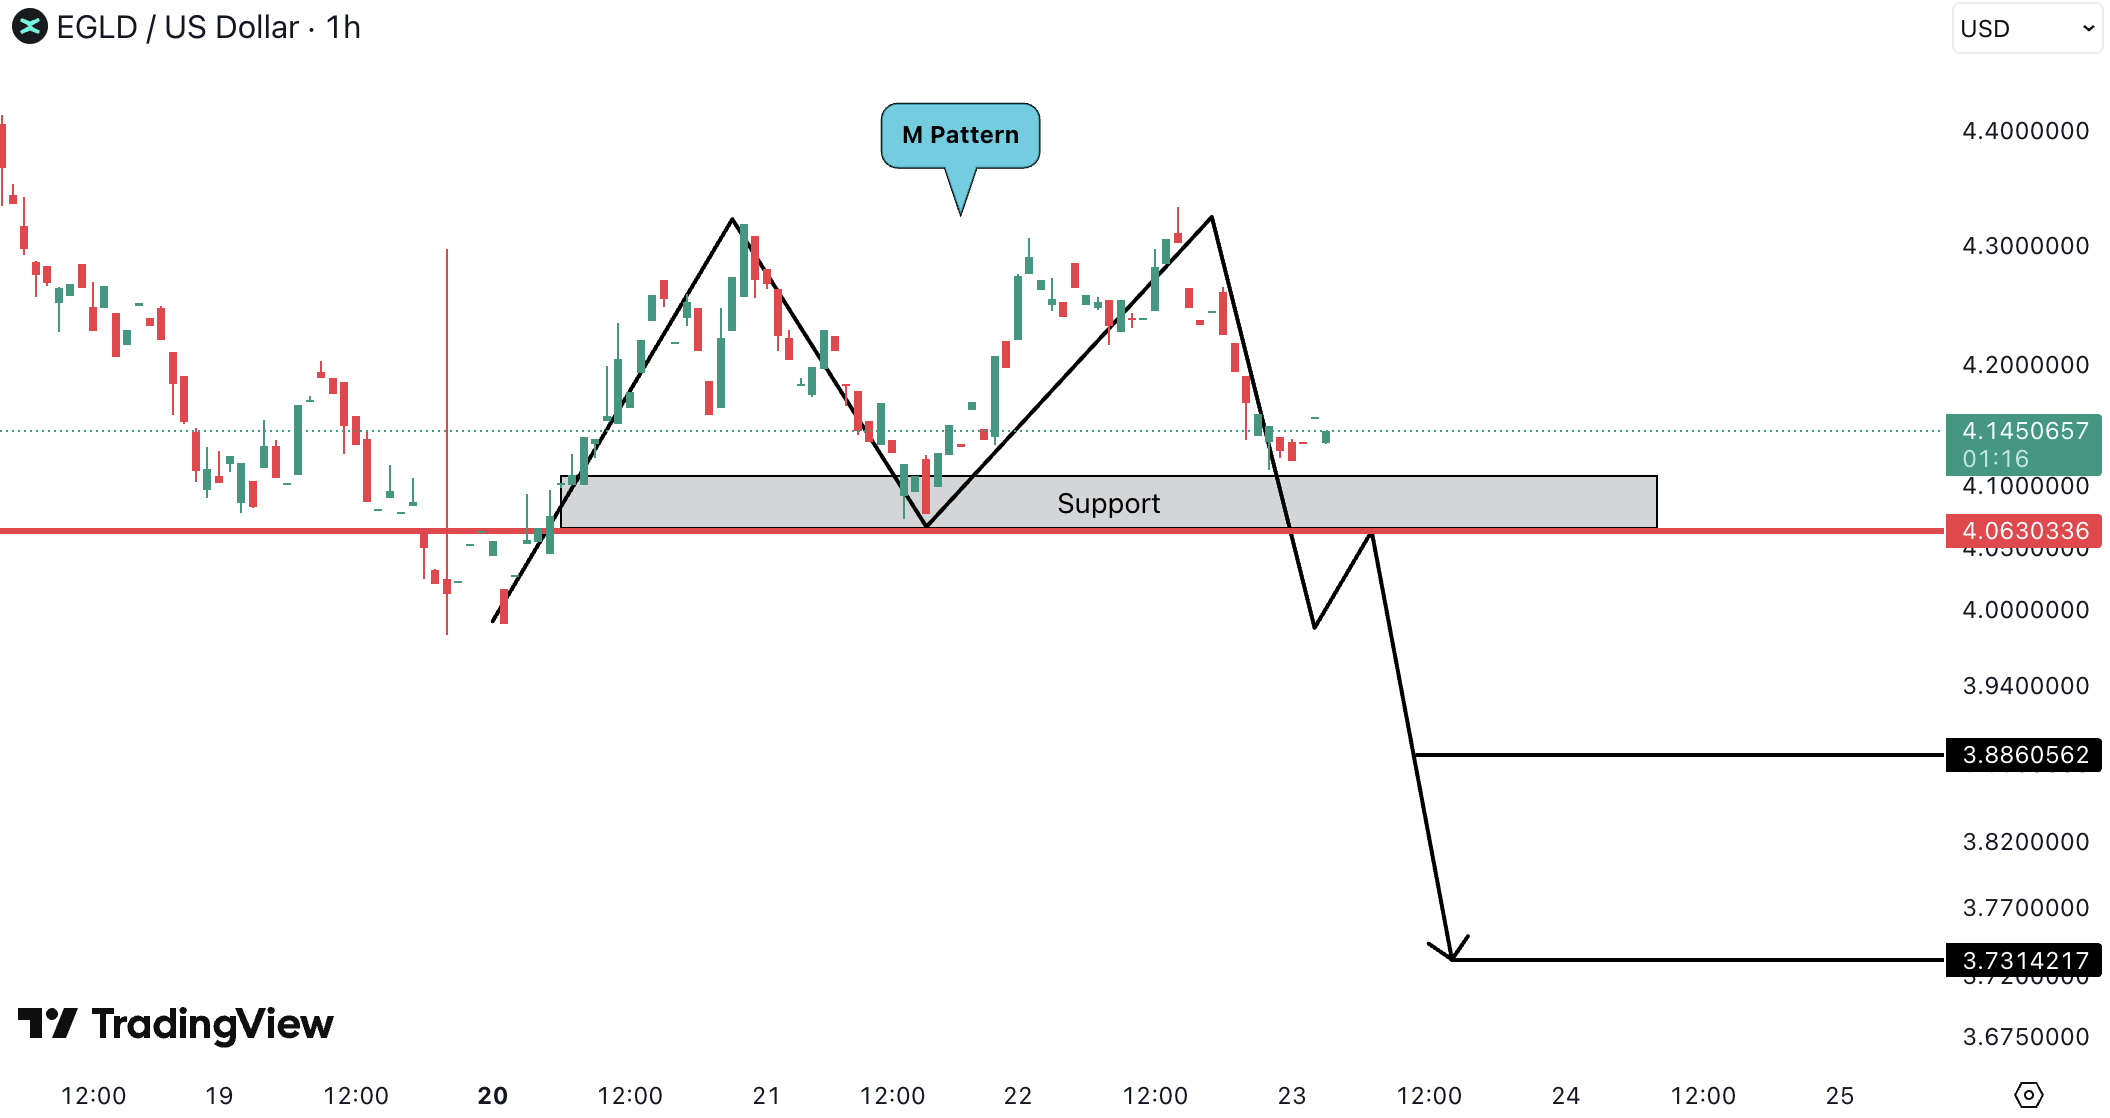
MultiversX (EGLD)
On the 1H timeframe, EGLD is forming a clear M pattern (double top). Price has already rejected from the second peak and is now sitting just above the support zone acting as the neckline at 4.06 USD (~3.73 EUR).
The structure shows clear distribution, with lower momentum after the second high.
If this support breaks cleanly, it would confirm the pattern and likely push price toward:
- 3.88 USD (~3.57 EUR)
- 3.73 USD (~3.43 EUR)
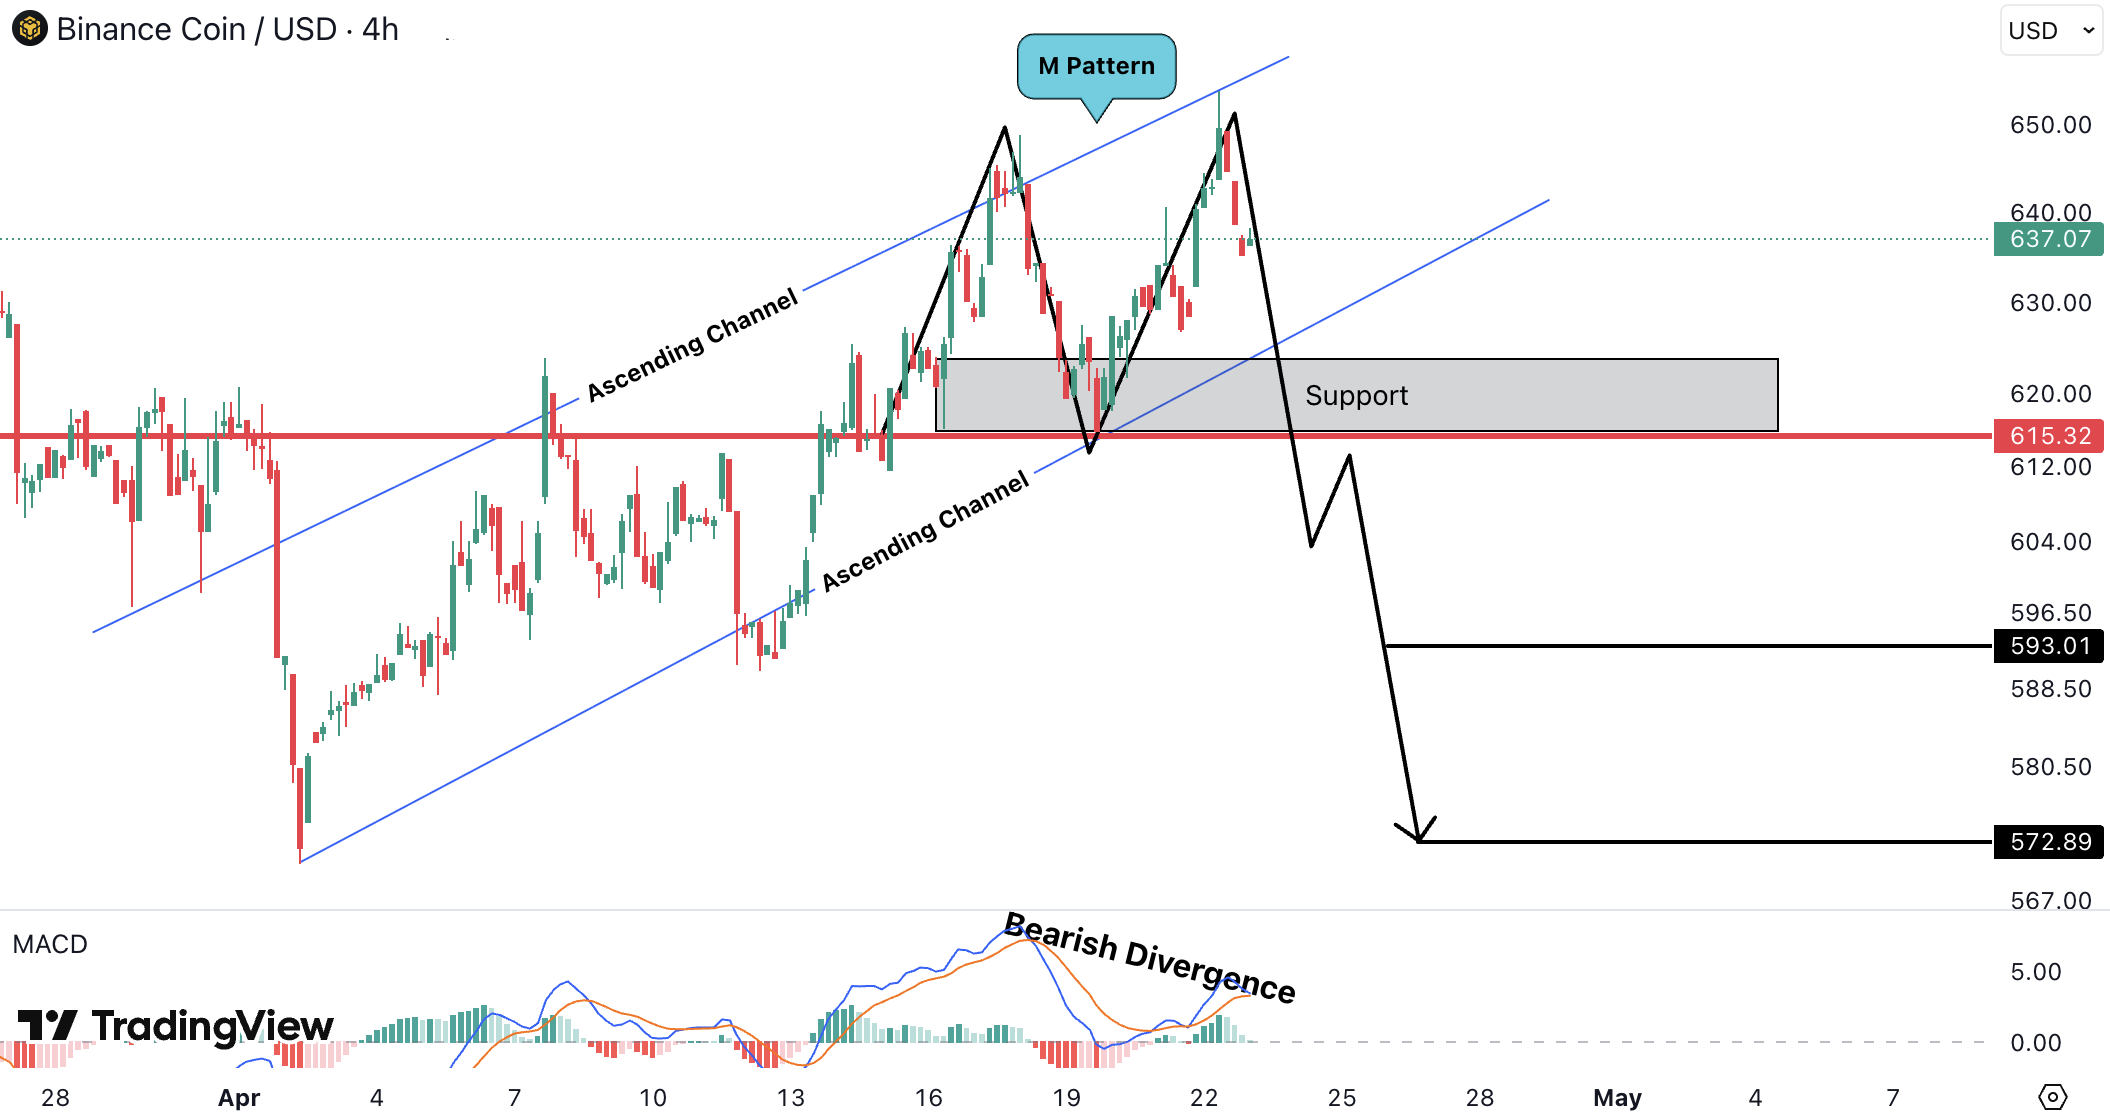
Binance Coin (BNB)
On the 4H timeframe, BNB is showing a clean M pattern (double top) right at the upper boundary of an ascending channel, combined with clear bearish divergence on MACD, which weakens the bullish structure.
Price has already started rejecting from the second top and is now approaching the key support zone (neckline) at 615 USD (~566 EUR), a crucial level.
A confirmed breakdown below this support would validate the pattern and likely trigger a continuation move toward:
- 593 USD (~546 EUR)
- 572 USD (~526 EUR)
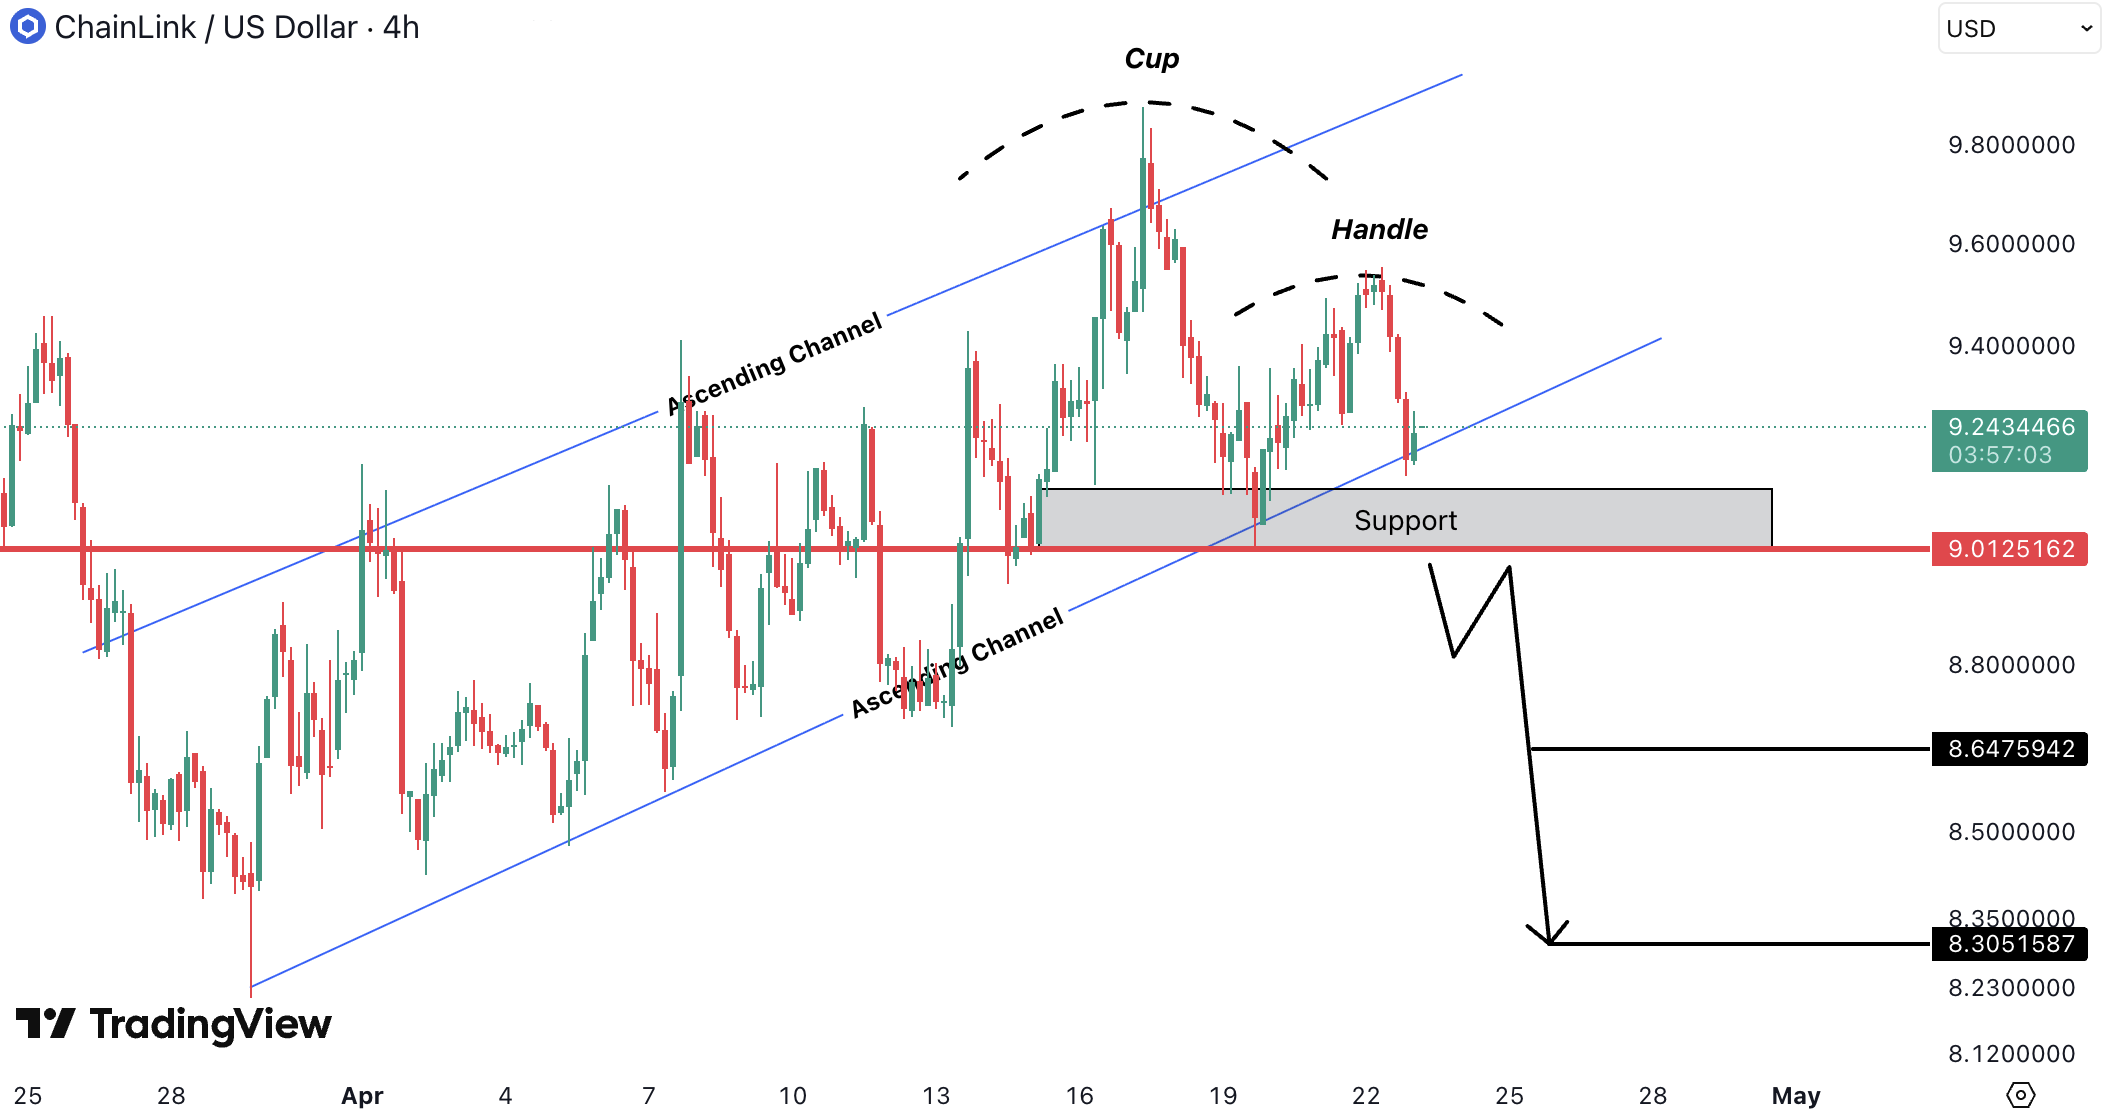
Chainlink (LINK)
On the 4H timeframe, LINK is forming a clear inverse cup & handle. Price created a rounded top (inverse cup), followed by a weak upward retracement (handle) that failed to sustain strength.
The rejection from the upper ascending channel and loss of momentum confirm distribution, with price now sitting near the key neckline support at 9.00 USD (~8.28 EUR).
A clean breakdown below this level would validate the pattern and likely trigger a move toward:
- 8.64 USD (~7.95 EUR)
- 8.30 USD (~7.64 EUR)
Estimation (96H)
- BTCUSD – 1% to 2% UP – holding above support with liquidity building above recent highs
- ETHUSD – 1% to 3% UP – higher low structure with strong relative momentum
- EGLDUSD – 2% to 4% UP – accumulation at demand zone with breakout potential
- LINKUSD – 2% to 4% UP – reclaim of support with continuation setup forming
- ADAUSD – 2% to 4% UP – compression phase with breakout momentum building
Limitation of Liability
This report issued by Tradesilvania is purely informative and is not intended to be used as a tool for making investment decisions in crypto-assets. Any person who chooses to use this report in the process of making investment decisions assumes all related risks. Tradesilvania SRL has no legal or other obligation towards the person in question that would derive from the publication of this report publicly.
The content provided on the Tradesilvania website is for informational purposes only and should not be considered as investment advice, financial advice, trading advice, or any other form of advice. We do not endorse or recommend the buying, selling, or holding of any cryptocurrency. It is important that you conduct your own research and consult with a financial advisor before making any investment decisions. We cannot be held responsible for any investment choices made based on the information presented on our website.
The information in this report was obtained from public sources and is considered relevant and reliable within the limits of publicly available data. However, the value of the digital assets referred to in this report fluctuates over time, and past performance does not indicate future growth.